>Better Graphs - I
> How to use graphical variables effectively.
\ Otho Mantegazza _ Dataviz for Scientists _ Part 3.1
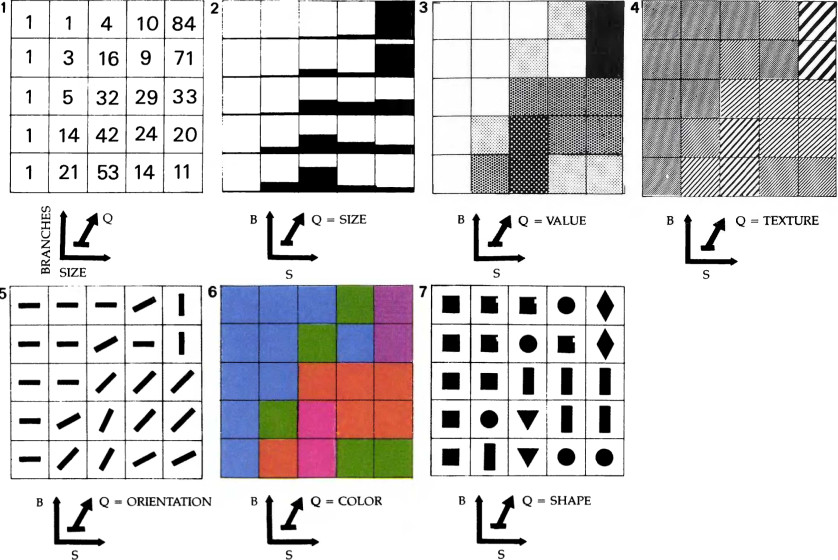
AUTHOR: Jacques Bertin
YEAR: 1967
BOOK: The Semiology of Graphics
Examples of planar and retinal variables.
Graphical Variables
When you draw a data visualization on a two dimensional screen, you map values from data variables to graphical variables:
- Planar Variables: x, y.
- Retinal Variables: colour hue, color value, shape, orientation, size, area, texture.
In terms of the grammar of graphics, the graphical variables are the aesthetics that you map your data to.
Planar Variables
The x and y planar variables are largely perceived as a quantitative linear space. And they are great for representing quantitative and qualitative data.
The planar variables are the x and y coordinates on your planar screen, which readily translate to the x and y positions in your graph.
(f you use cartesian coordinates or to a transformed version of them if you use more elaborate coordinate systems)
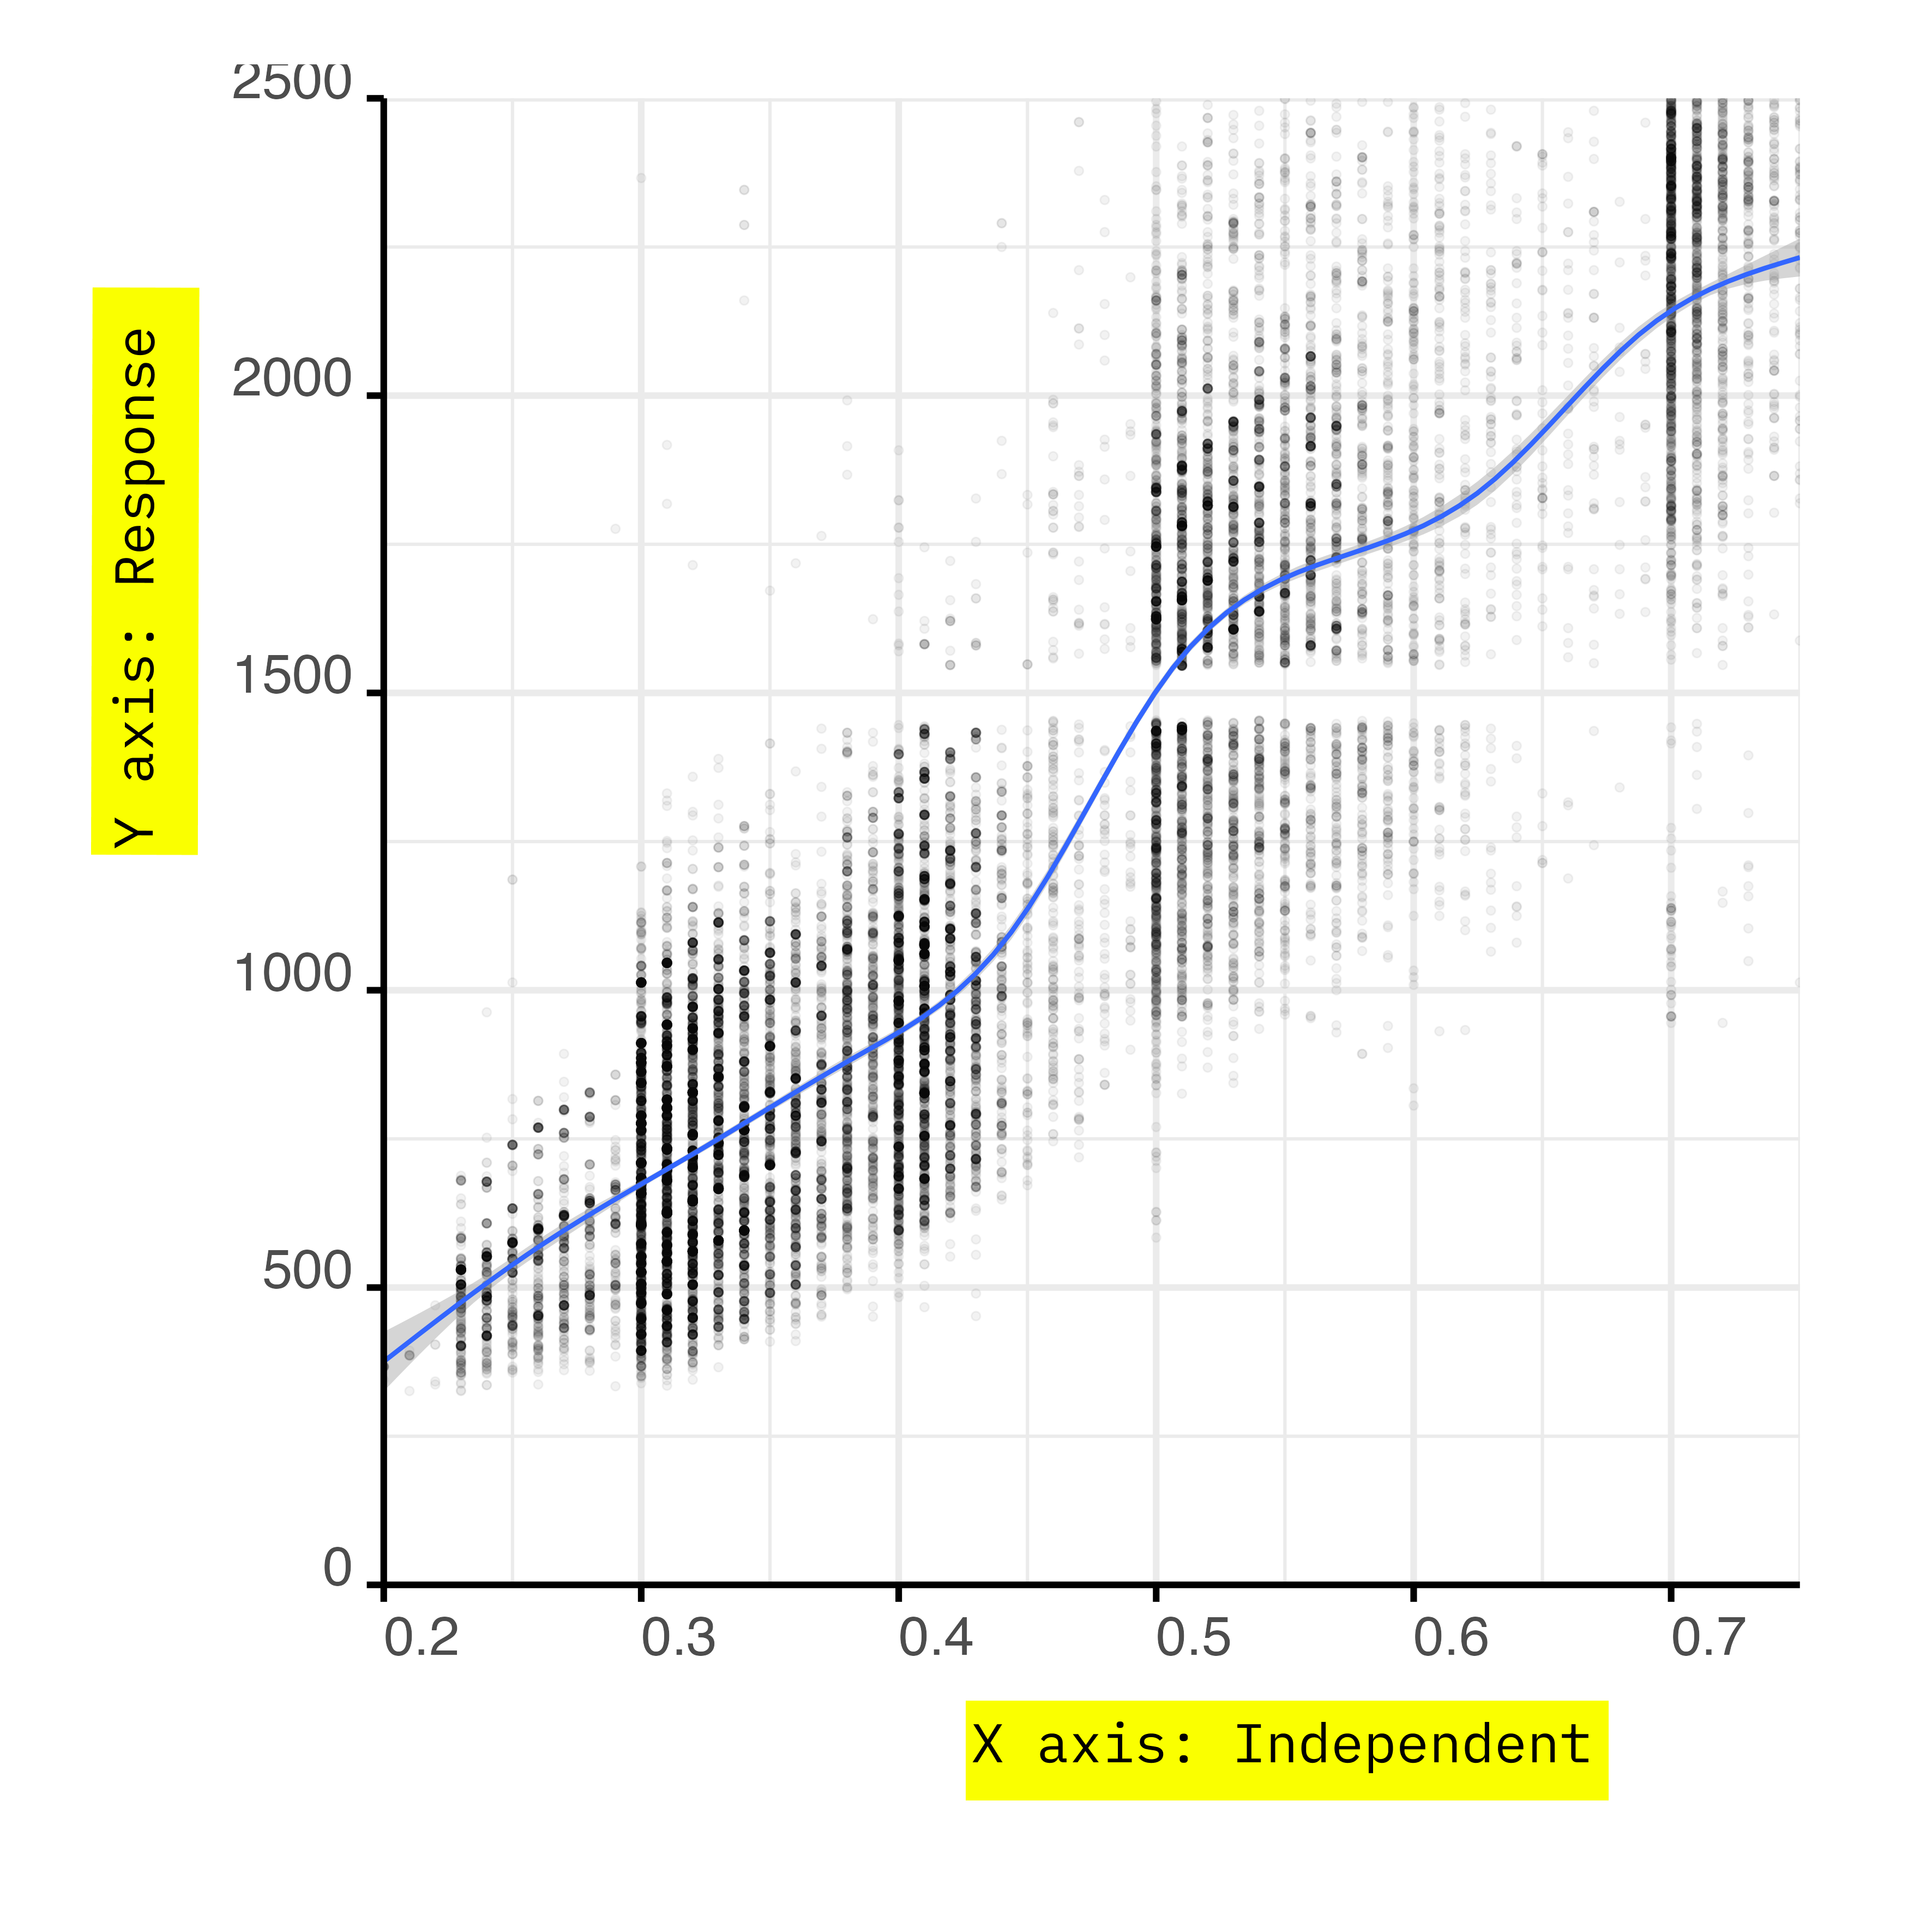
Planar Variables
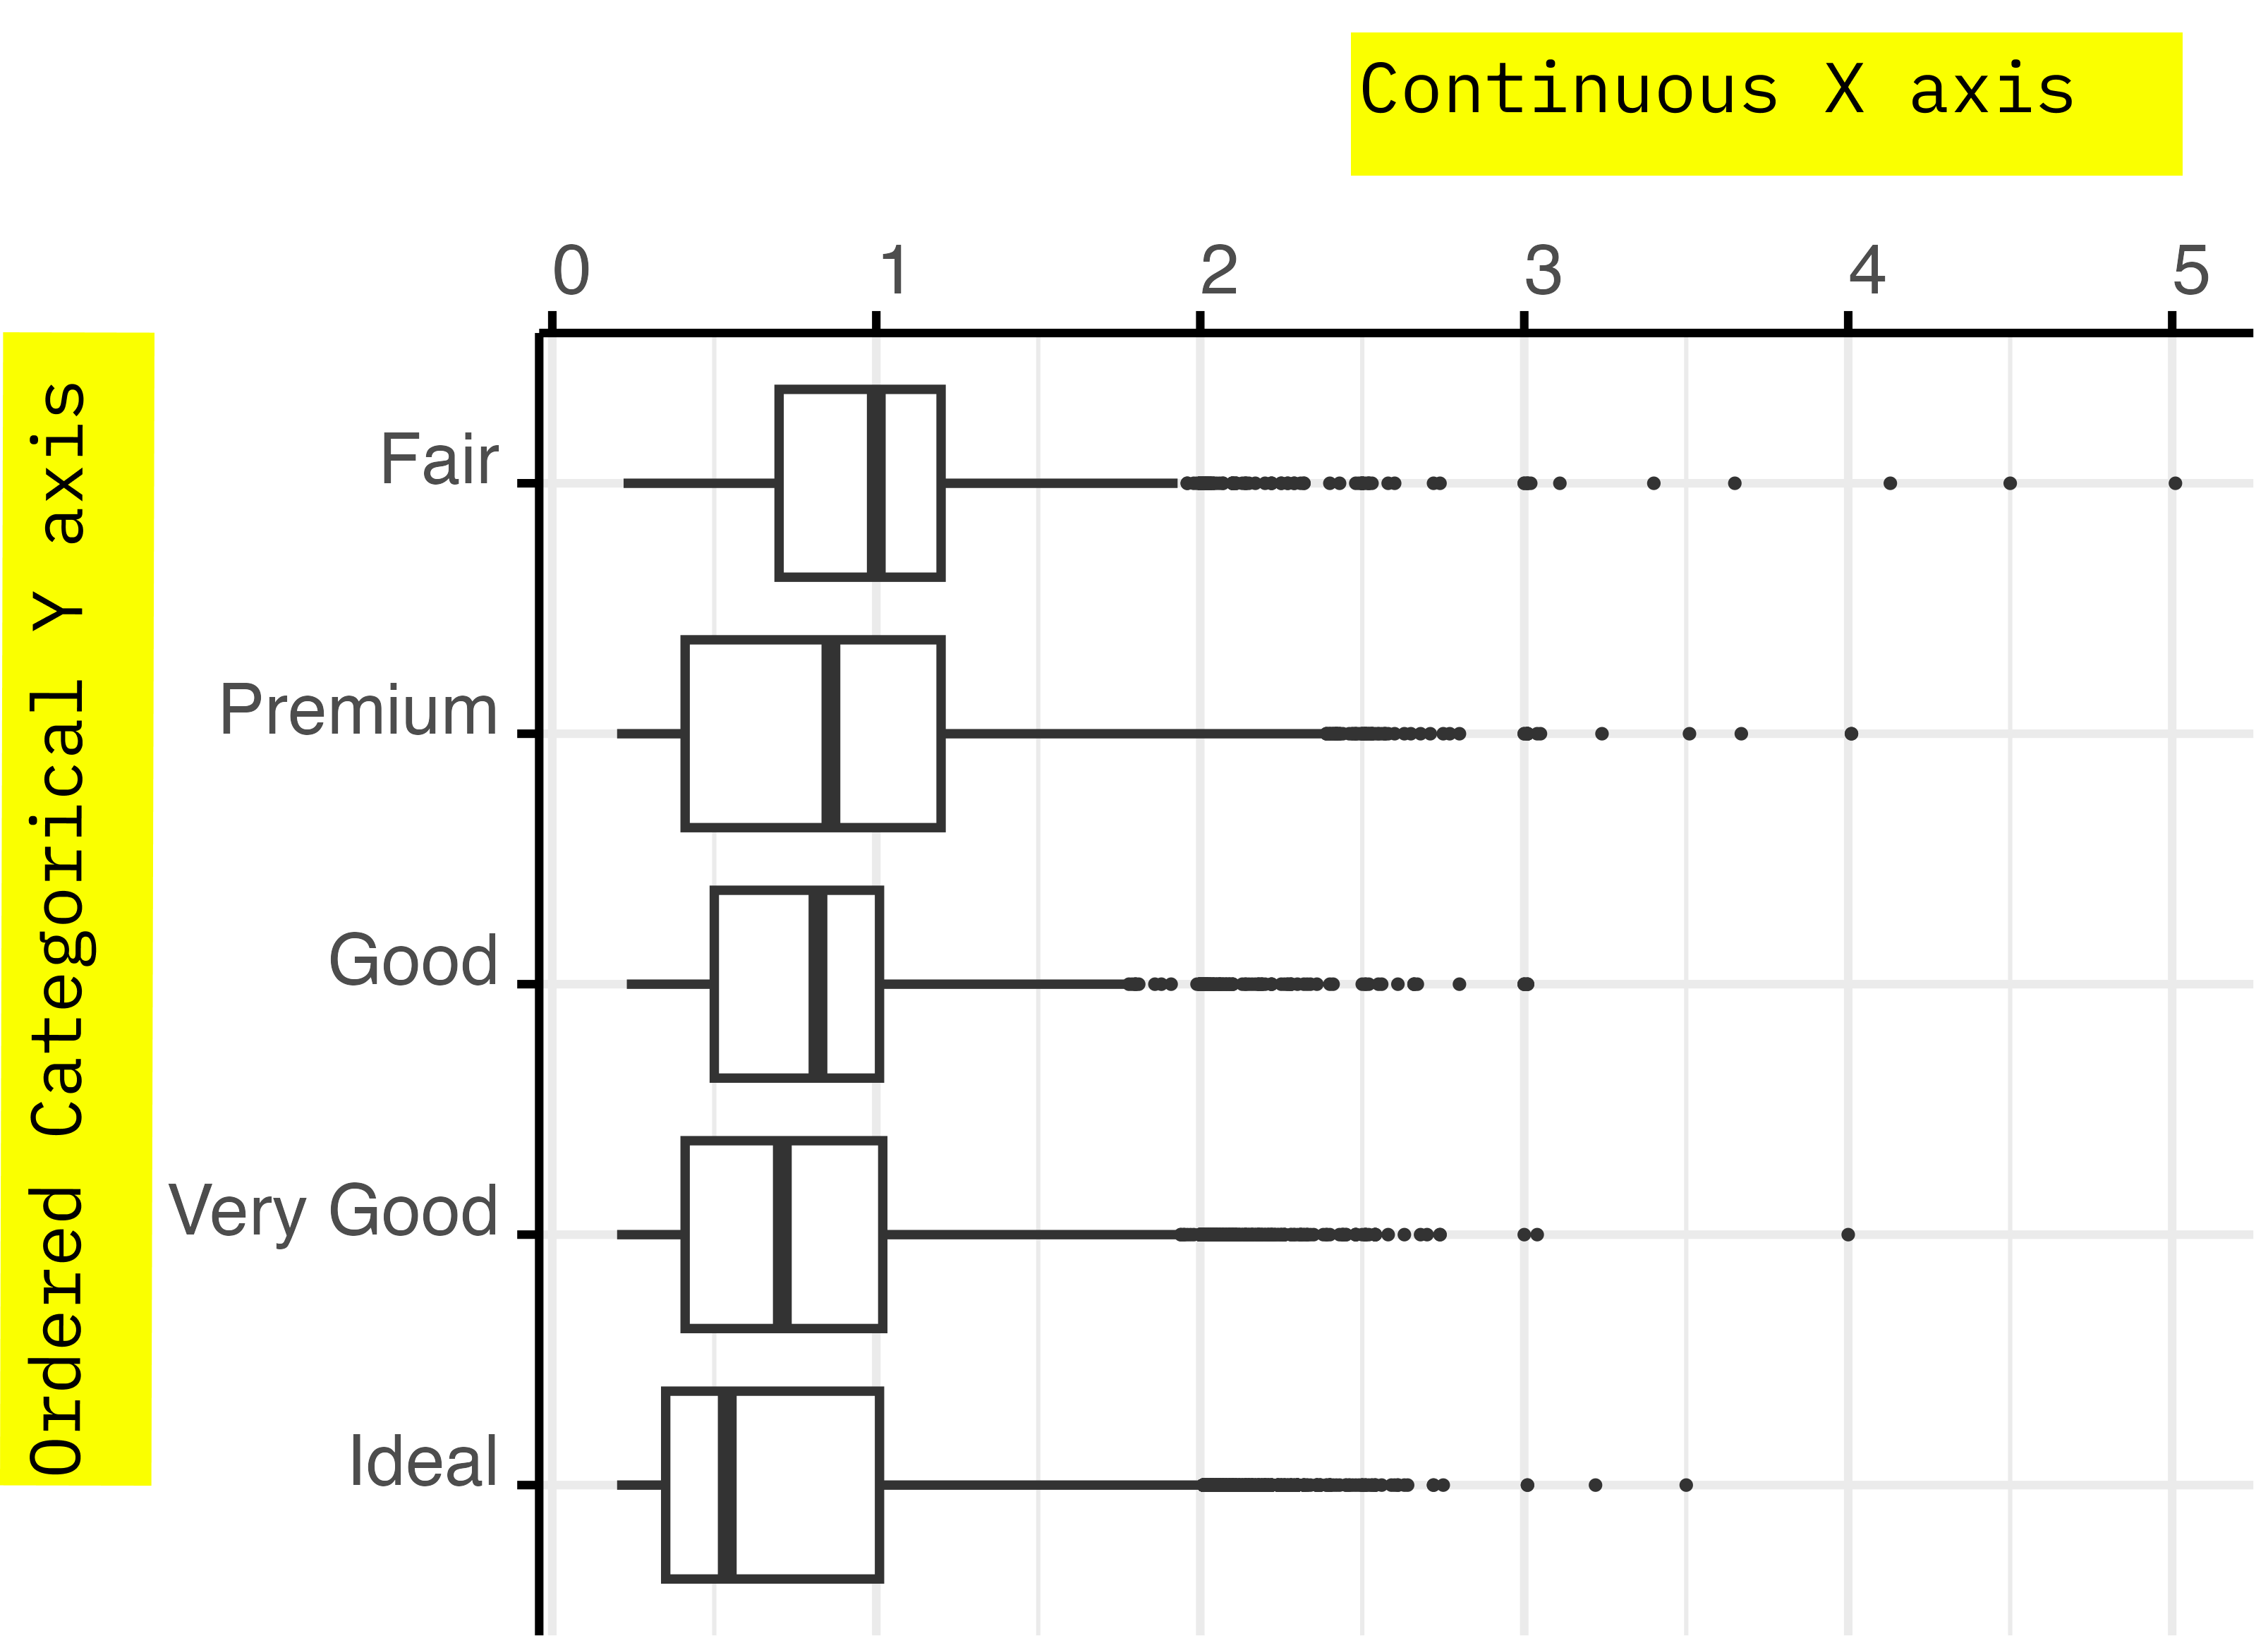
You can place qualitative variables both in the x and y variable. In this case the x might stop being the independent variable, and the y stops being the response.
Often there is no clear hypothetical relationship of cause effect between two variables, in that case you can invert the x and the y freely.
Retinal Variables
The retinal variables are all those other graphical variables, that cannot be interpreted directly as a position on the screen’s x and y.
The most important retinal variables are colour hue, color value, shape, orientation, size, area, texture.
Each one has its own peculiarities and its own rules about how it can be used best.
Colour
Colours can be mapped both to categorical and continuous variables.
With some caveats, colours are a multidimensional space:
- Not perceived in a fully linear way.
- Perceived in different ways by different people.
Color Spaces
If you find it hard to plan colours, don’t worry, colours are complex for everyone.
On a screen, colours are defined as three hexadecimal strings, that combine 256 levels of red, green and blue.
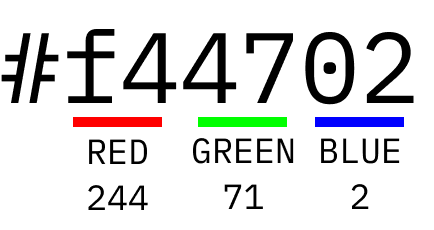
Color Spaces
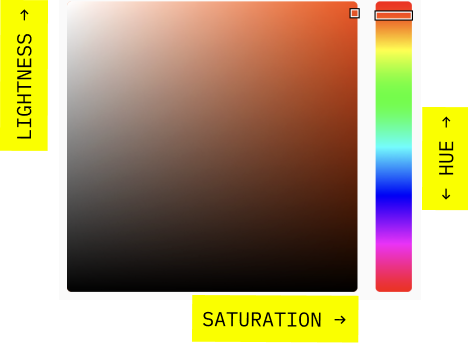
Colors are perceived non linearly, and the model of how colors are perceived by people gets constantly updated. The most used model is CIECAM02.
What should interest you is:
- HUE: what we call colour.
- LIGHTNESS: how close to black?
- SATURATION: how close to gray?
Categorical Variables
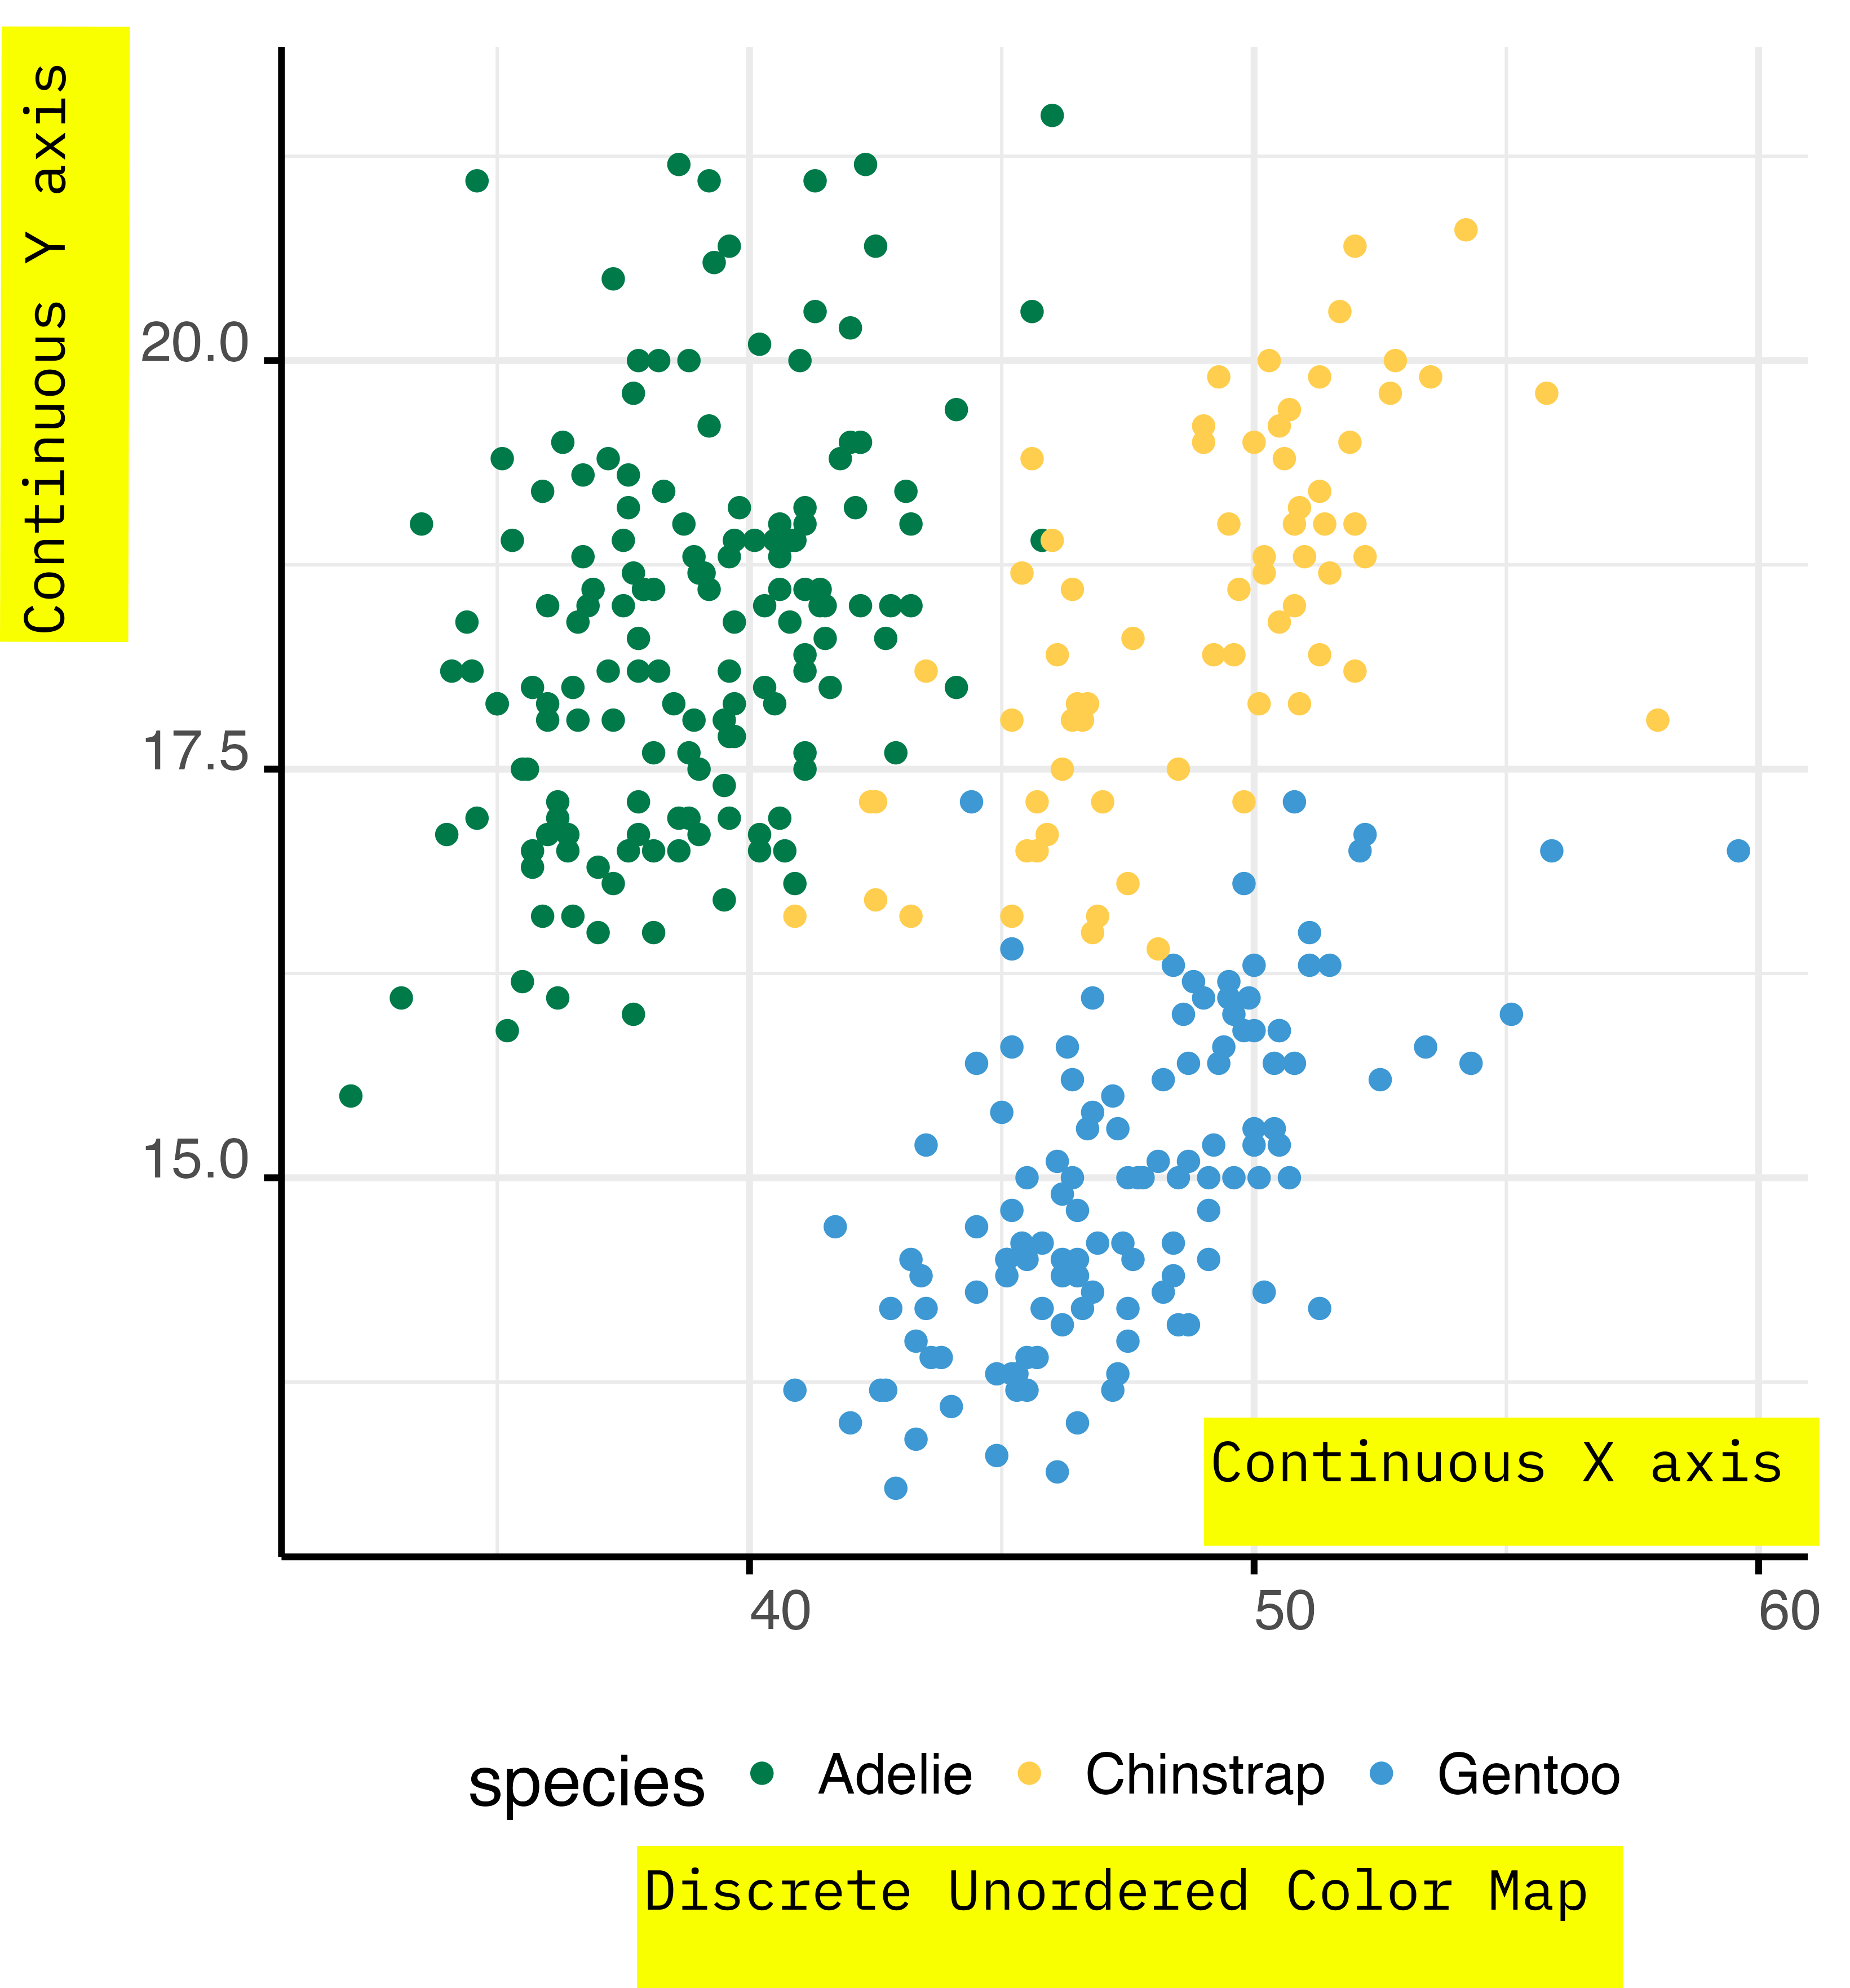
You can use colours to encode for categorical variables.
If the categorical variable is not ordered you should modulate the colors hue, with also small changes to saturation and lightness.
Always check if your colour palette is accessible by colour blind people.
Continous Variables
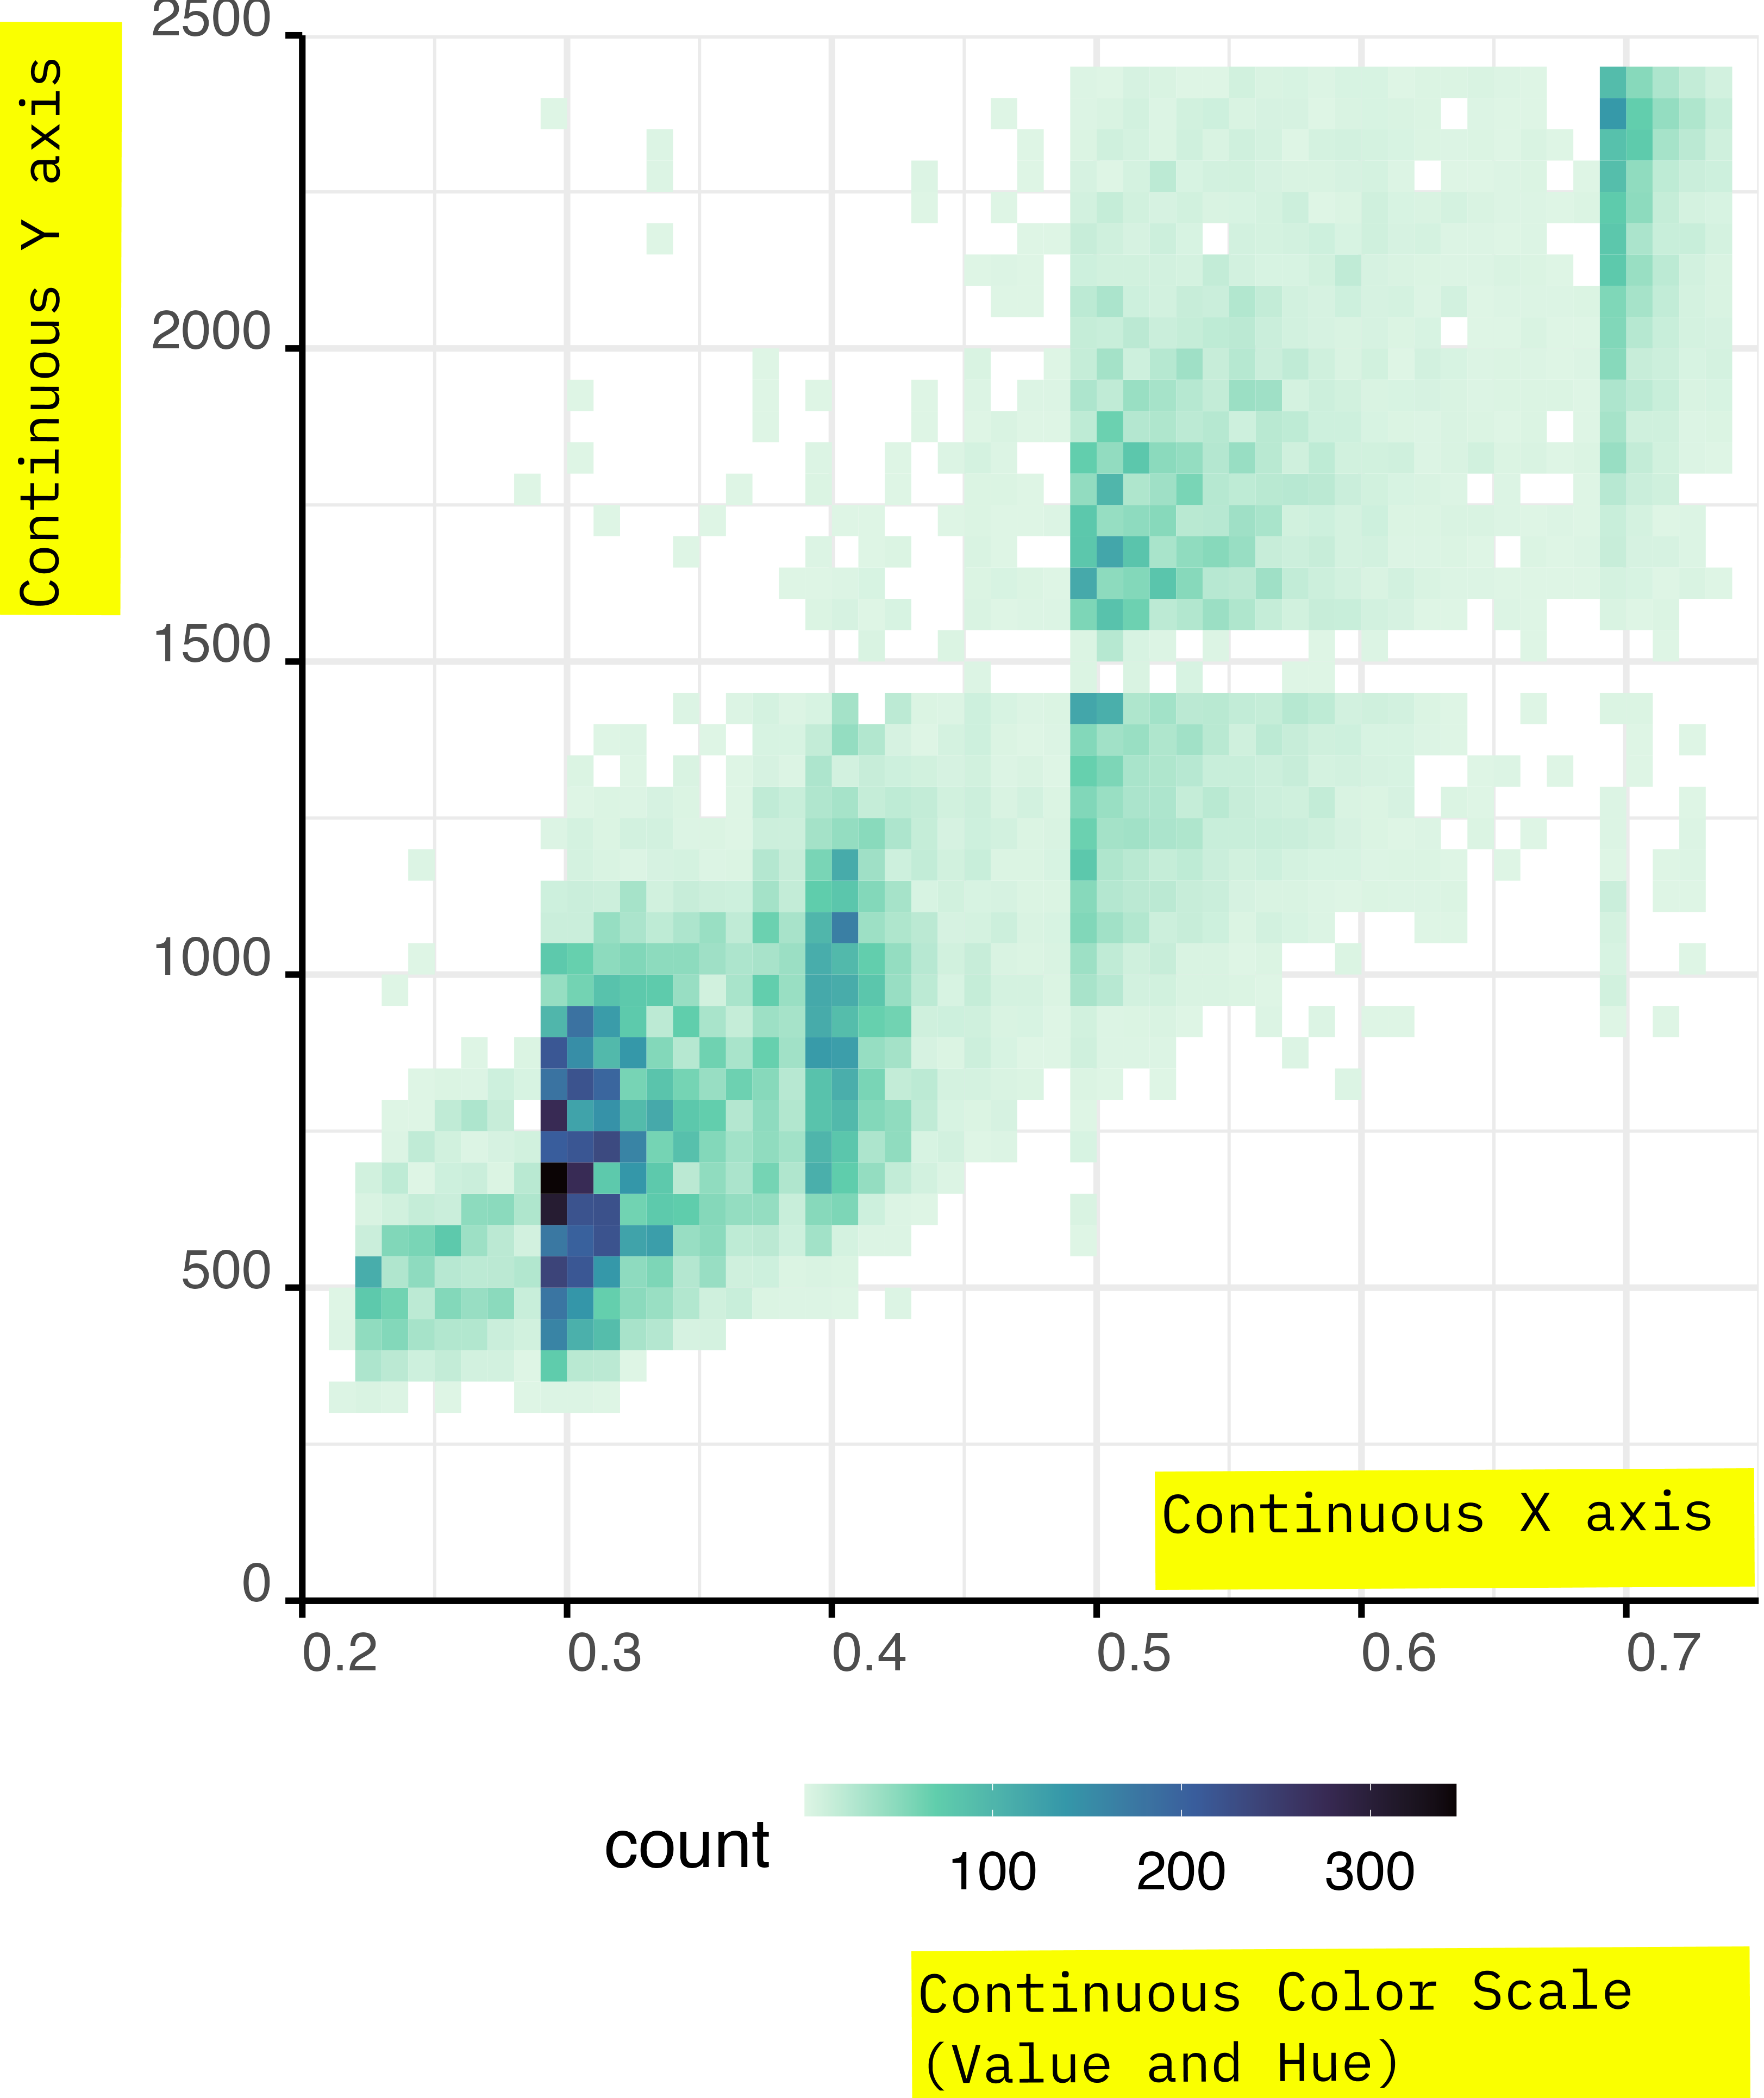
Using colours to encode continuous variables is somehow easier.
- Check that your colour palette is colour-blind friendly.
- Check that lightness and saturation change consistently with the data.
- You can modulate the hue resembling colours of natural phenomena; such as clouds, sunsets, rivers…

Colour Perception
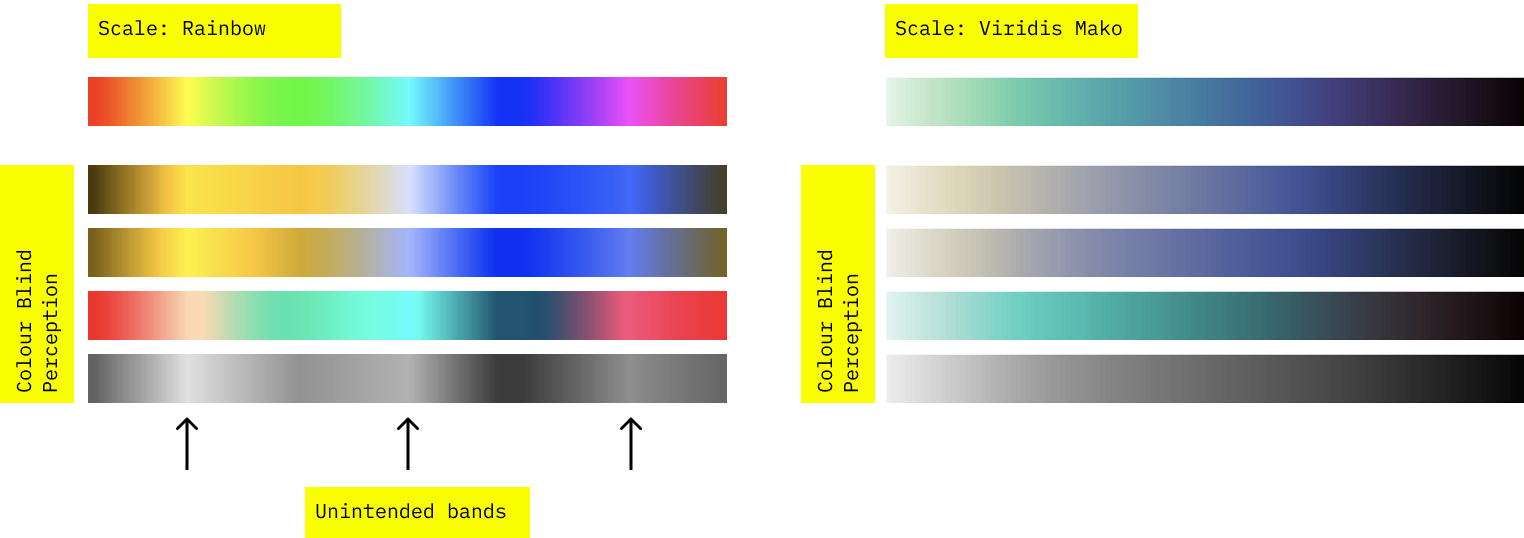
If you check that your palette are friendly to colour blind people, you can also detect unwanted patterns perception patterns.
You can use Firefox accessibility tools to simulate colour blind perception.
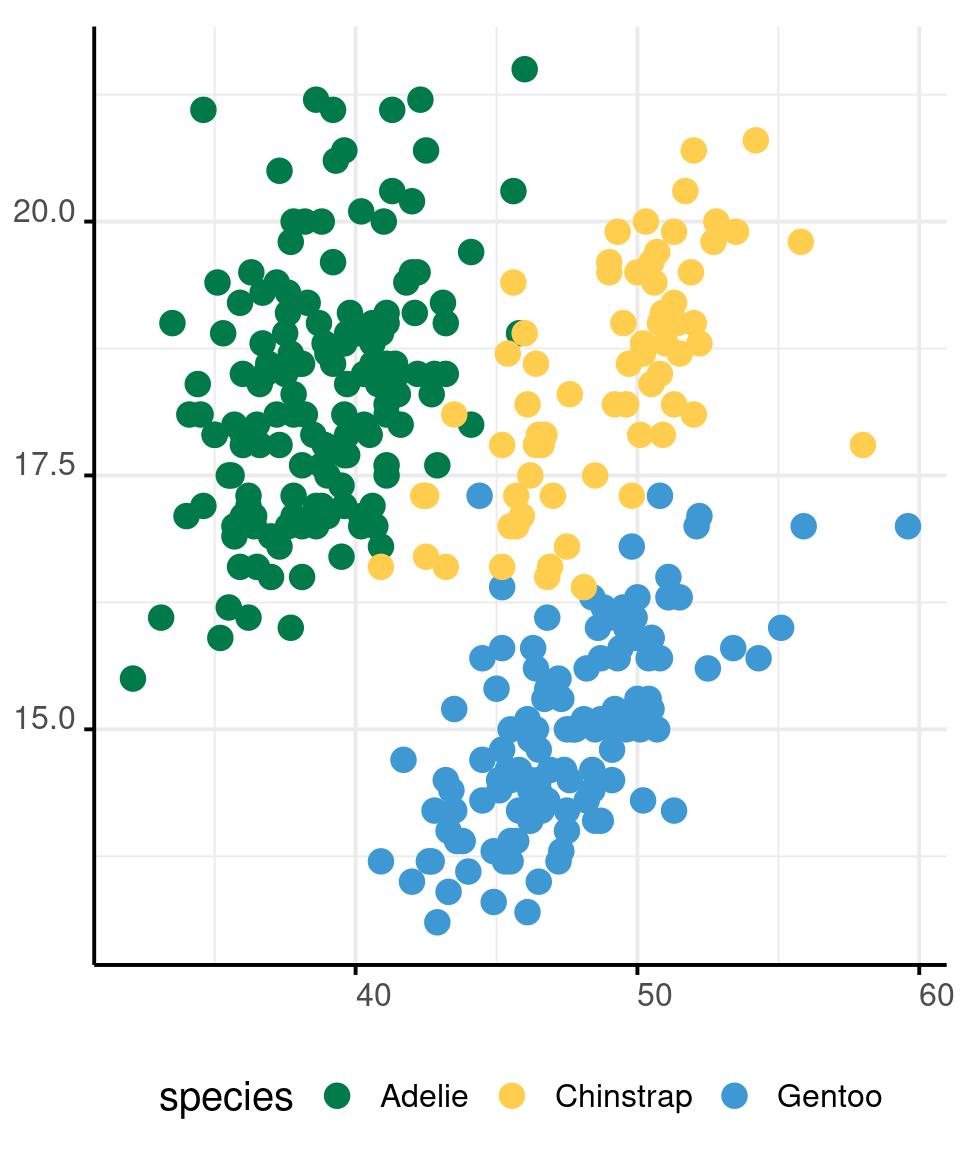
Good Colour Palettes


Categorical
In categorical palettes, you should be able to distinguish colours, even in small plotting characters.
Check if colours are different, even when plotted in black and white. Otherwise consider using and additional graphical variable to encode the information.
Quantitative
Continuous colour palette should be perceived linearly and univocally throughout the spectra. Check that this is true also for color blindness and black and white.
You should handle ordered categorical variables as if they were quantitative, not categorical.
Good Colour Palettes
Remember, data visualization is processed intuitively by the readers.
Colours have meaning. Don’t represent ice coverage in red, don’t represent the warming of the ocean in blue, ask yourself if your colour palette is appropriate for the topic your data are about.
Colours in R
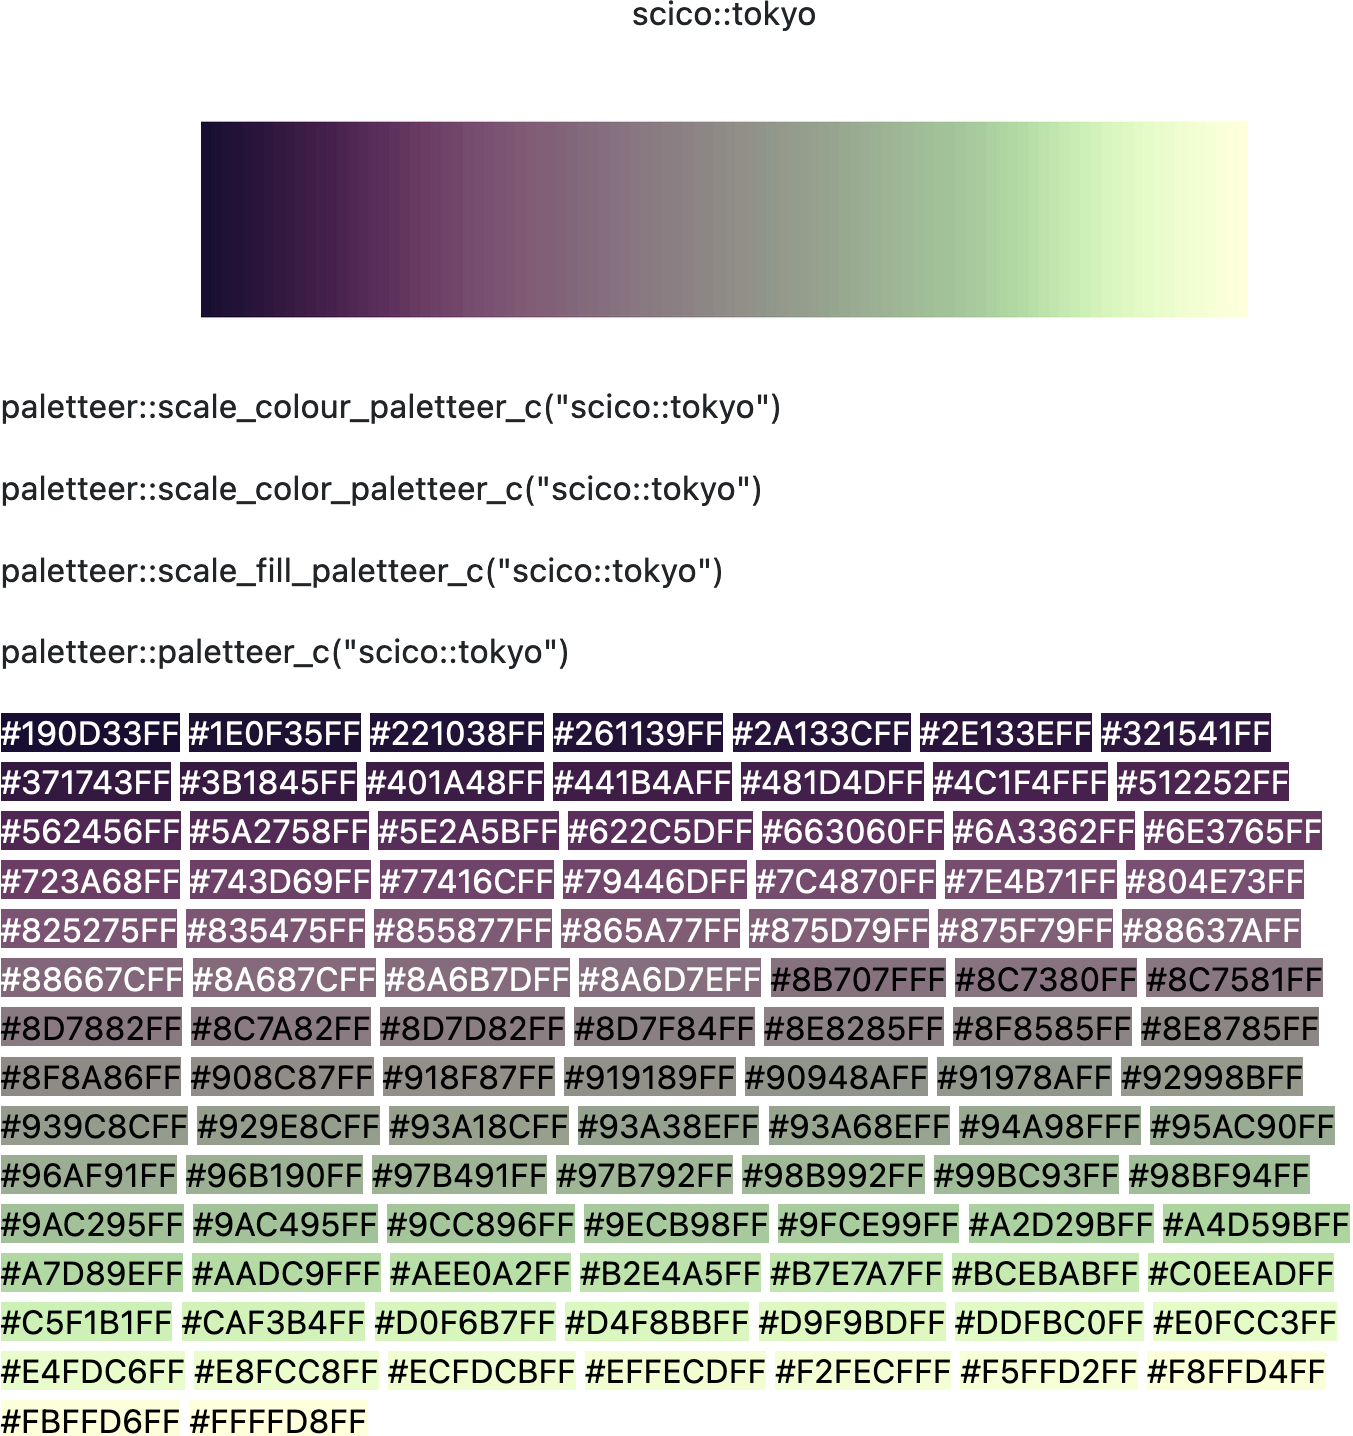
There are plenty of colour palette available in R, so it’s unlikely that you’ll have to design your own.
It’s more likely that you’ll have to be able to choose a good one.
The palette gallery from the paletteer package is a great place to start.
Also, check the blog posts presenting cubehelix, the viridis and batlow for an intro on perceptually uniform color maps.
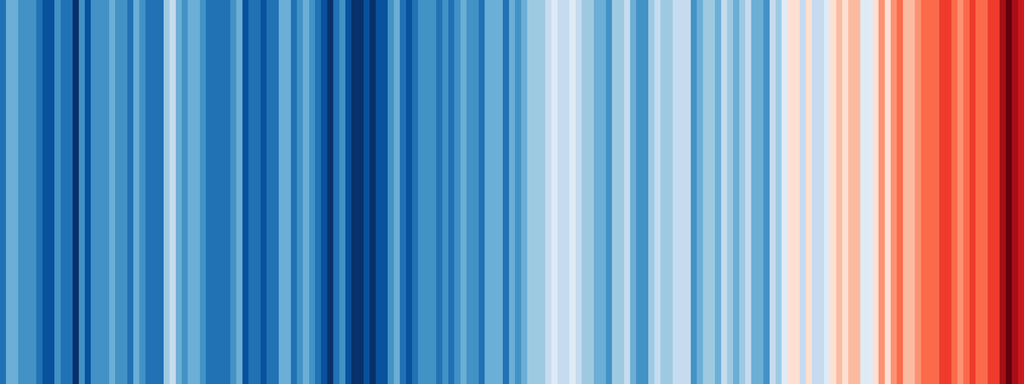
Researcher Ed Hawkins was searching for an intuitive way to represent global warming.
He designed the concept of climate stripes, removing everything that’s not a direct mapping of data from an heatmap of average temperature.
On the x axis, each stripe is a year, from the year when the first data recording is available reliably.
The colour represents the relative change in temperature.
The y axis is not mapped to the data.
Exercise
Check the climate stripes with a tool to simulate colour blind vision. Are the climate stripes colour blind friendly? Motivate your anwser.
Colours in R
Like any other graphical variables, colours in ggplot2 can be encoded with the family of functions:
- scale_colour_*()
- scale_fill_*()
Check the documentation on the ggplot2 book.
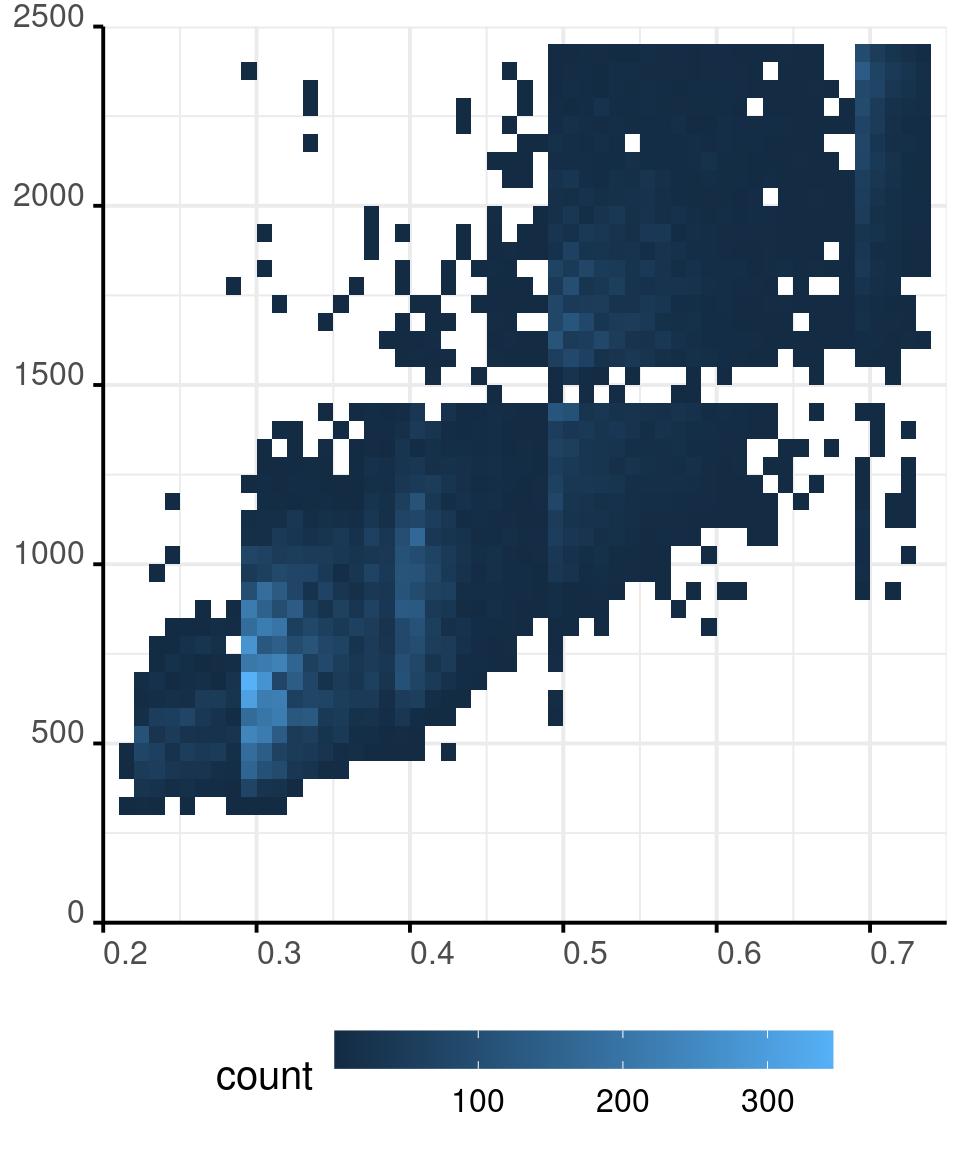
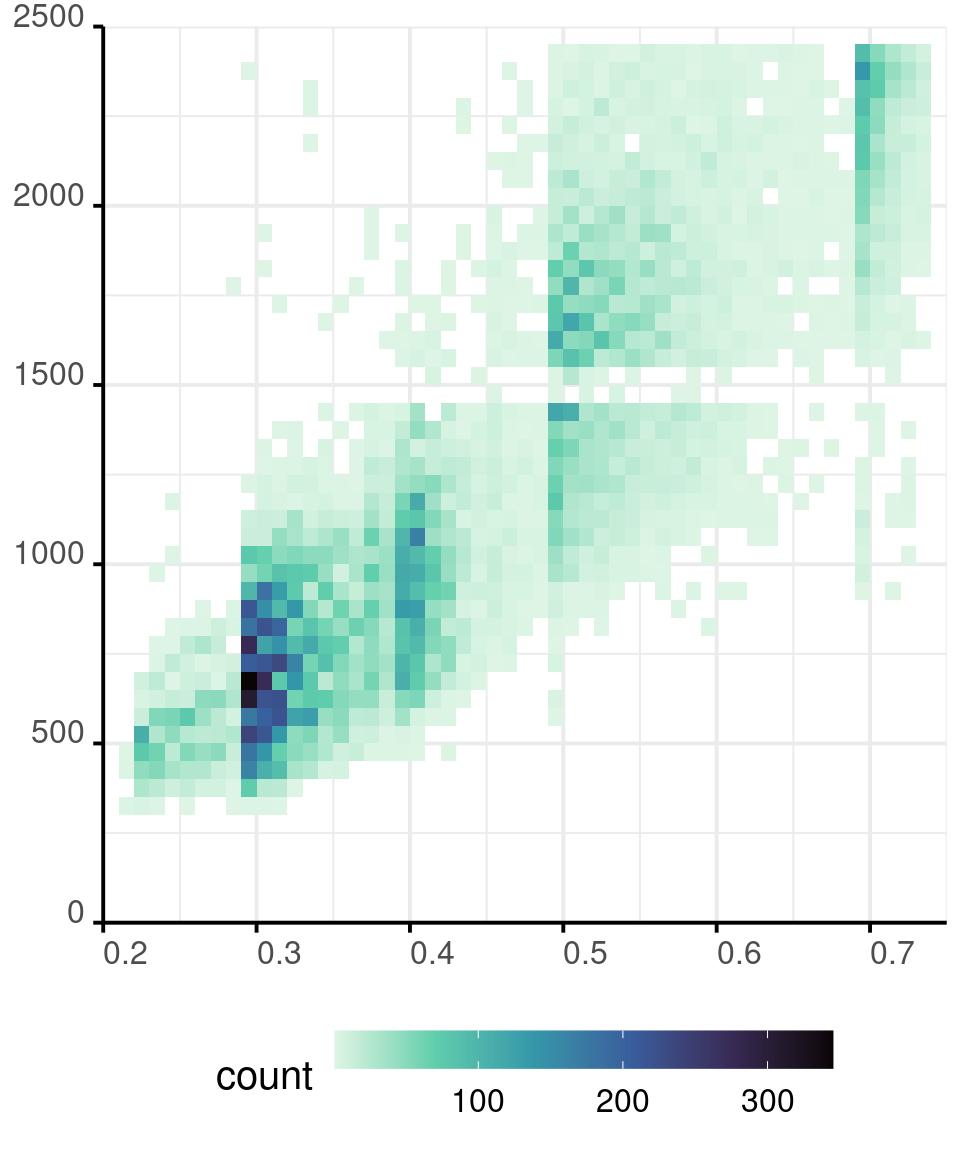
Colours in R - Continuous
Colours in R - Continuous
diamonds %>%
  ggplot() +
  aes(x = carat,
      y = price) +
  geom_bin_2d(
    binwidth = c(0.01, 50)
  ) +
  scale_x_continuous(
    expand = expansion(0, 0),
    limits = c(.2, .75)
  ) +
  scale_y_continuous(
    expand = expansion(0, 0),
    limits = c(0, 2500)
  ) +
  scale_fill_viridis_c(
    direction = -1,
    option = 'G'
  ) +
  guides(
    fill = guide_colourbar(
      barwidth = 13,
      barheight = 1)
  )
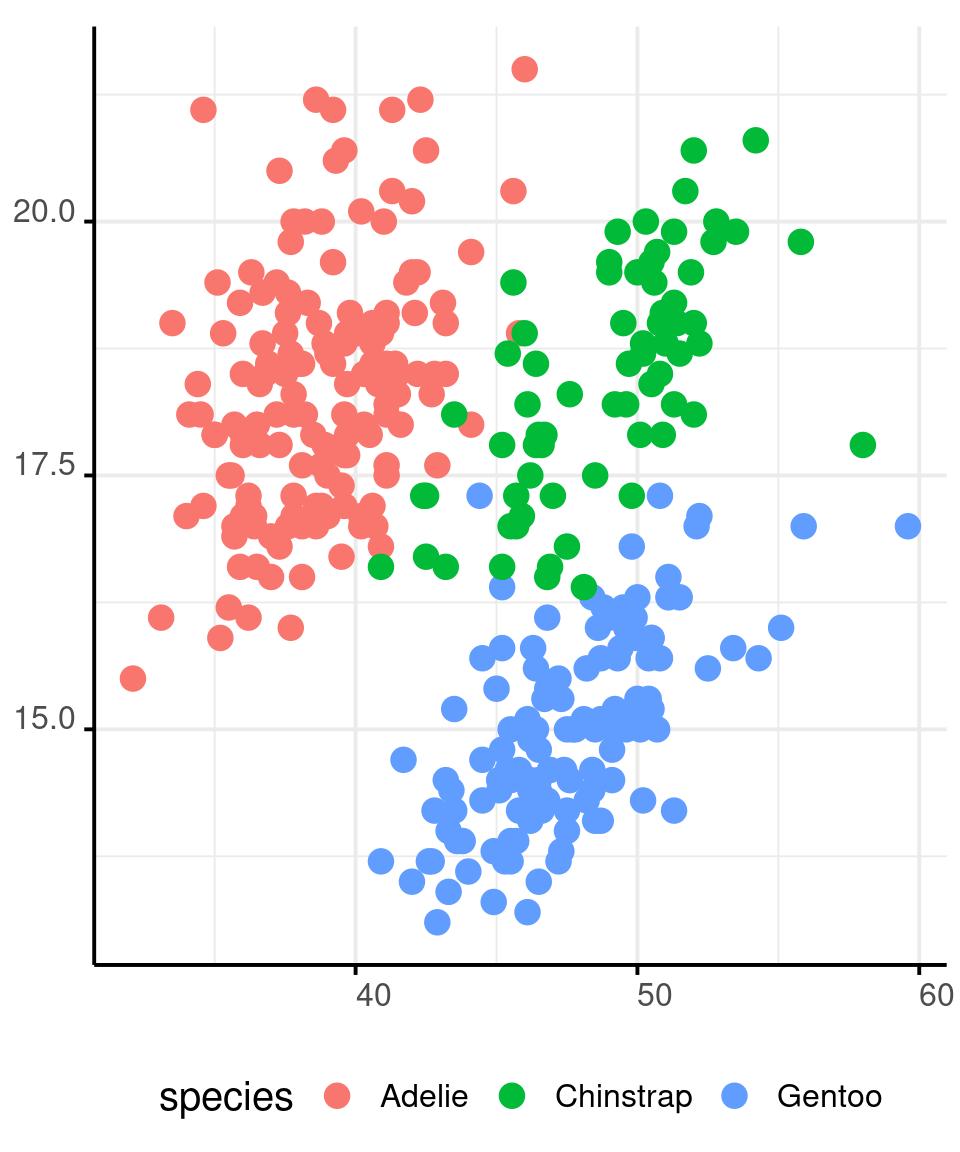
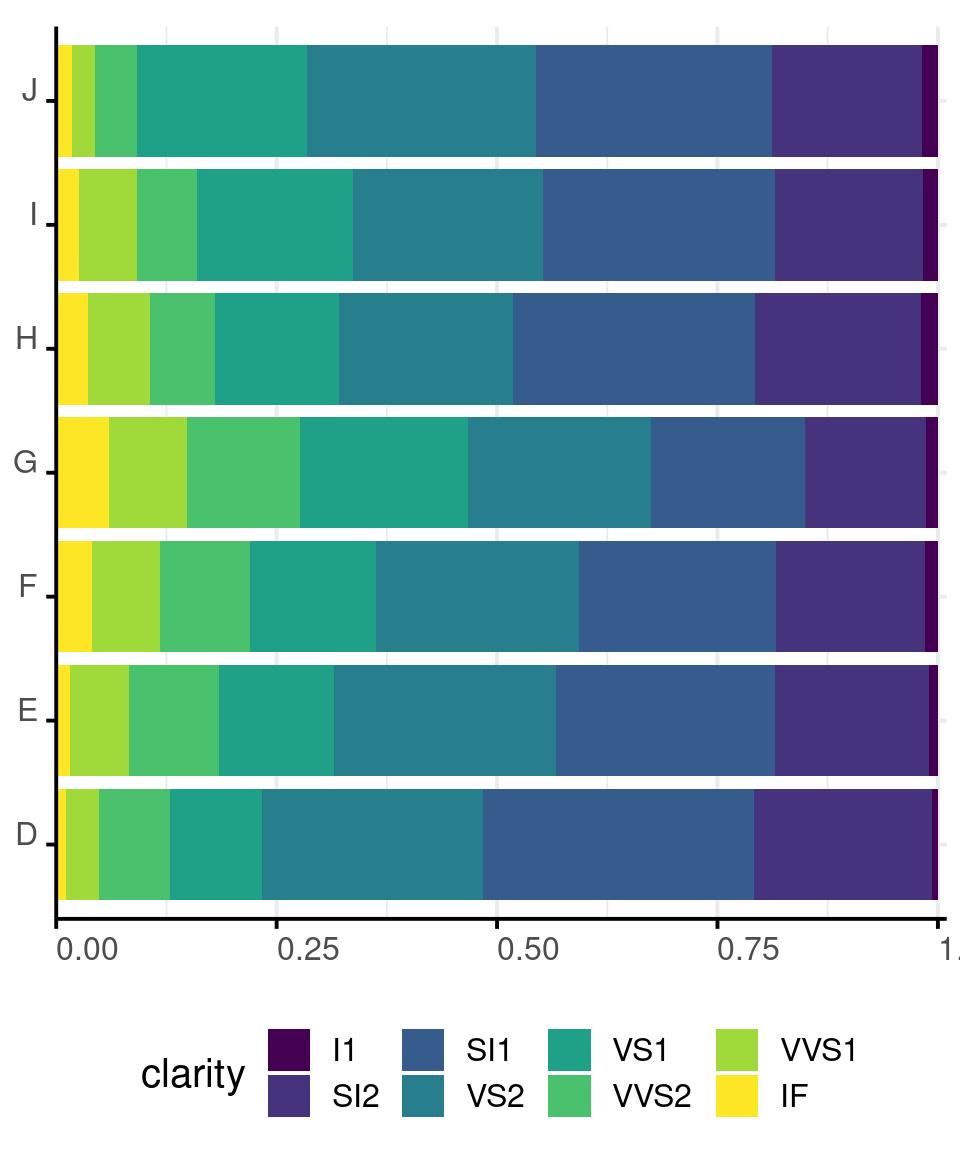
Colours in R - Categorical
Colours in R - Categorical
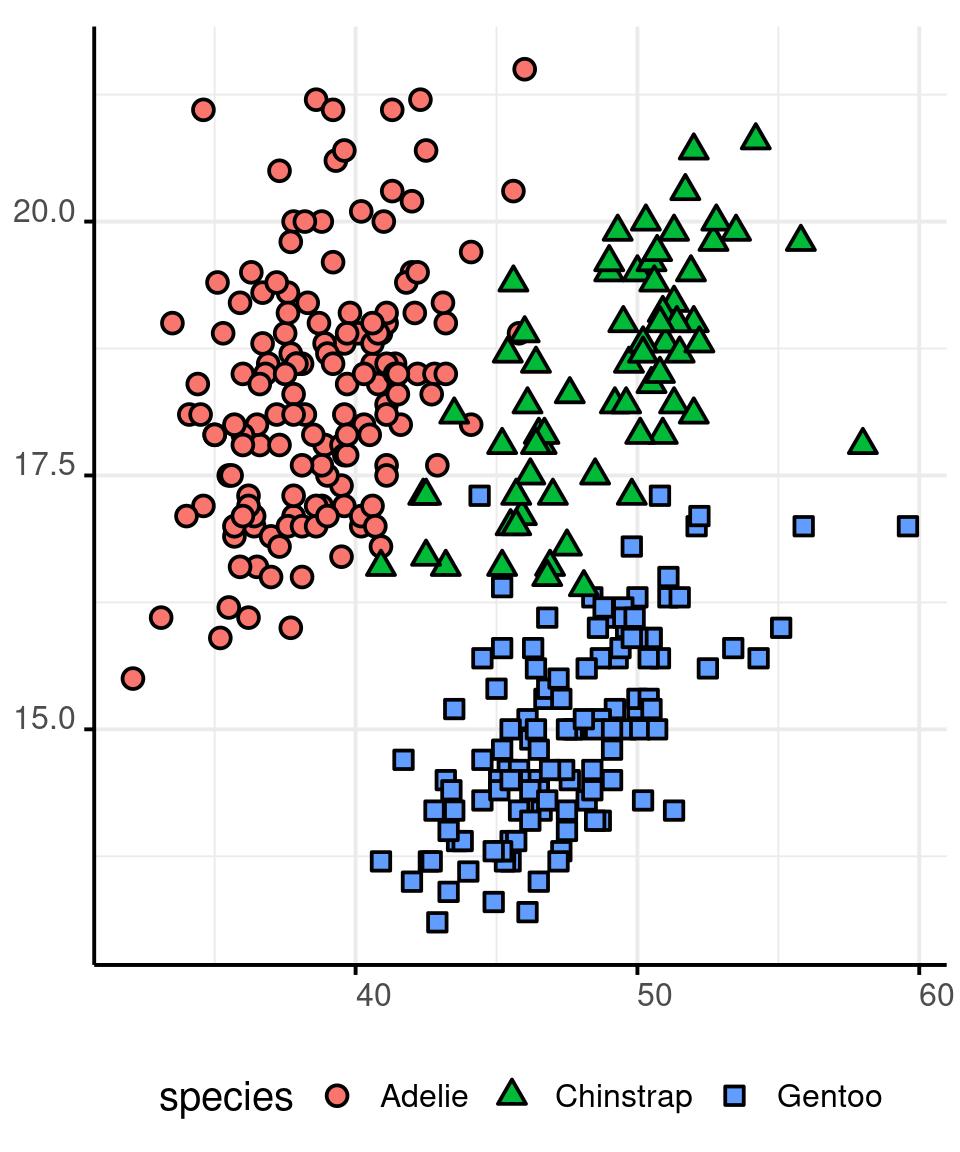
Shape
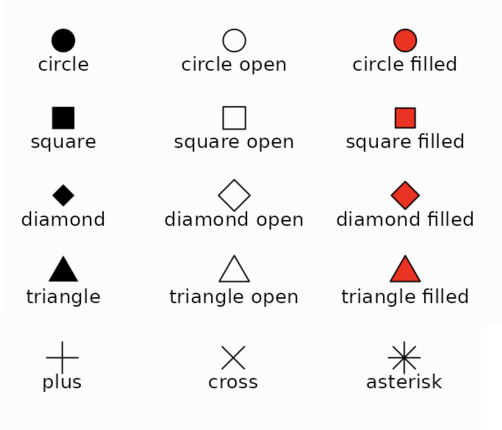
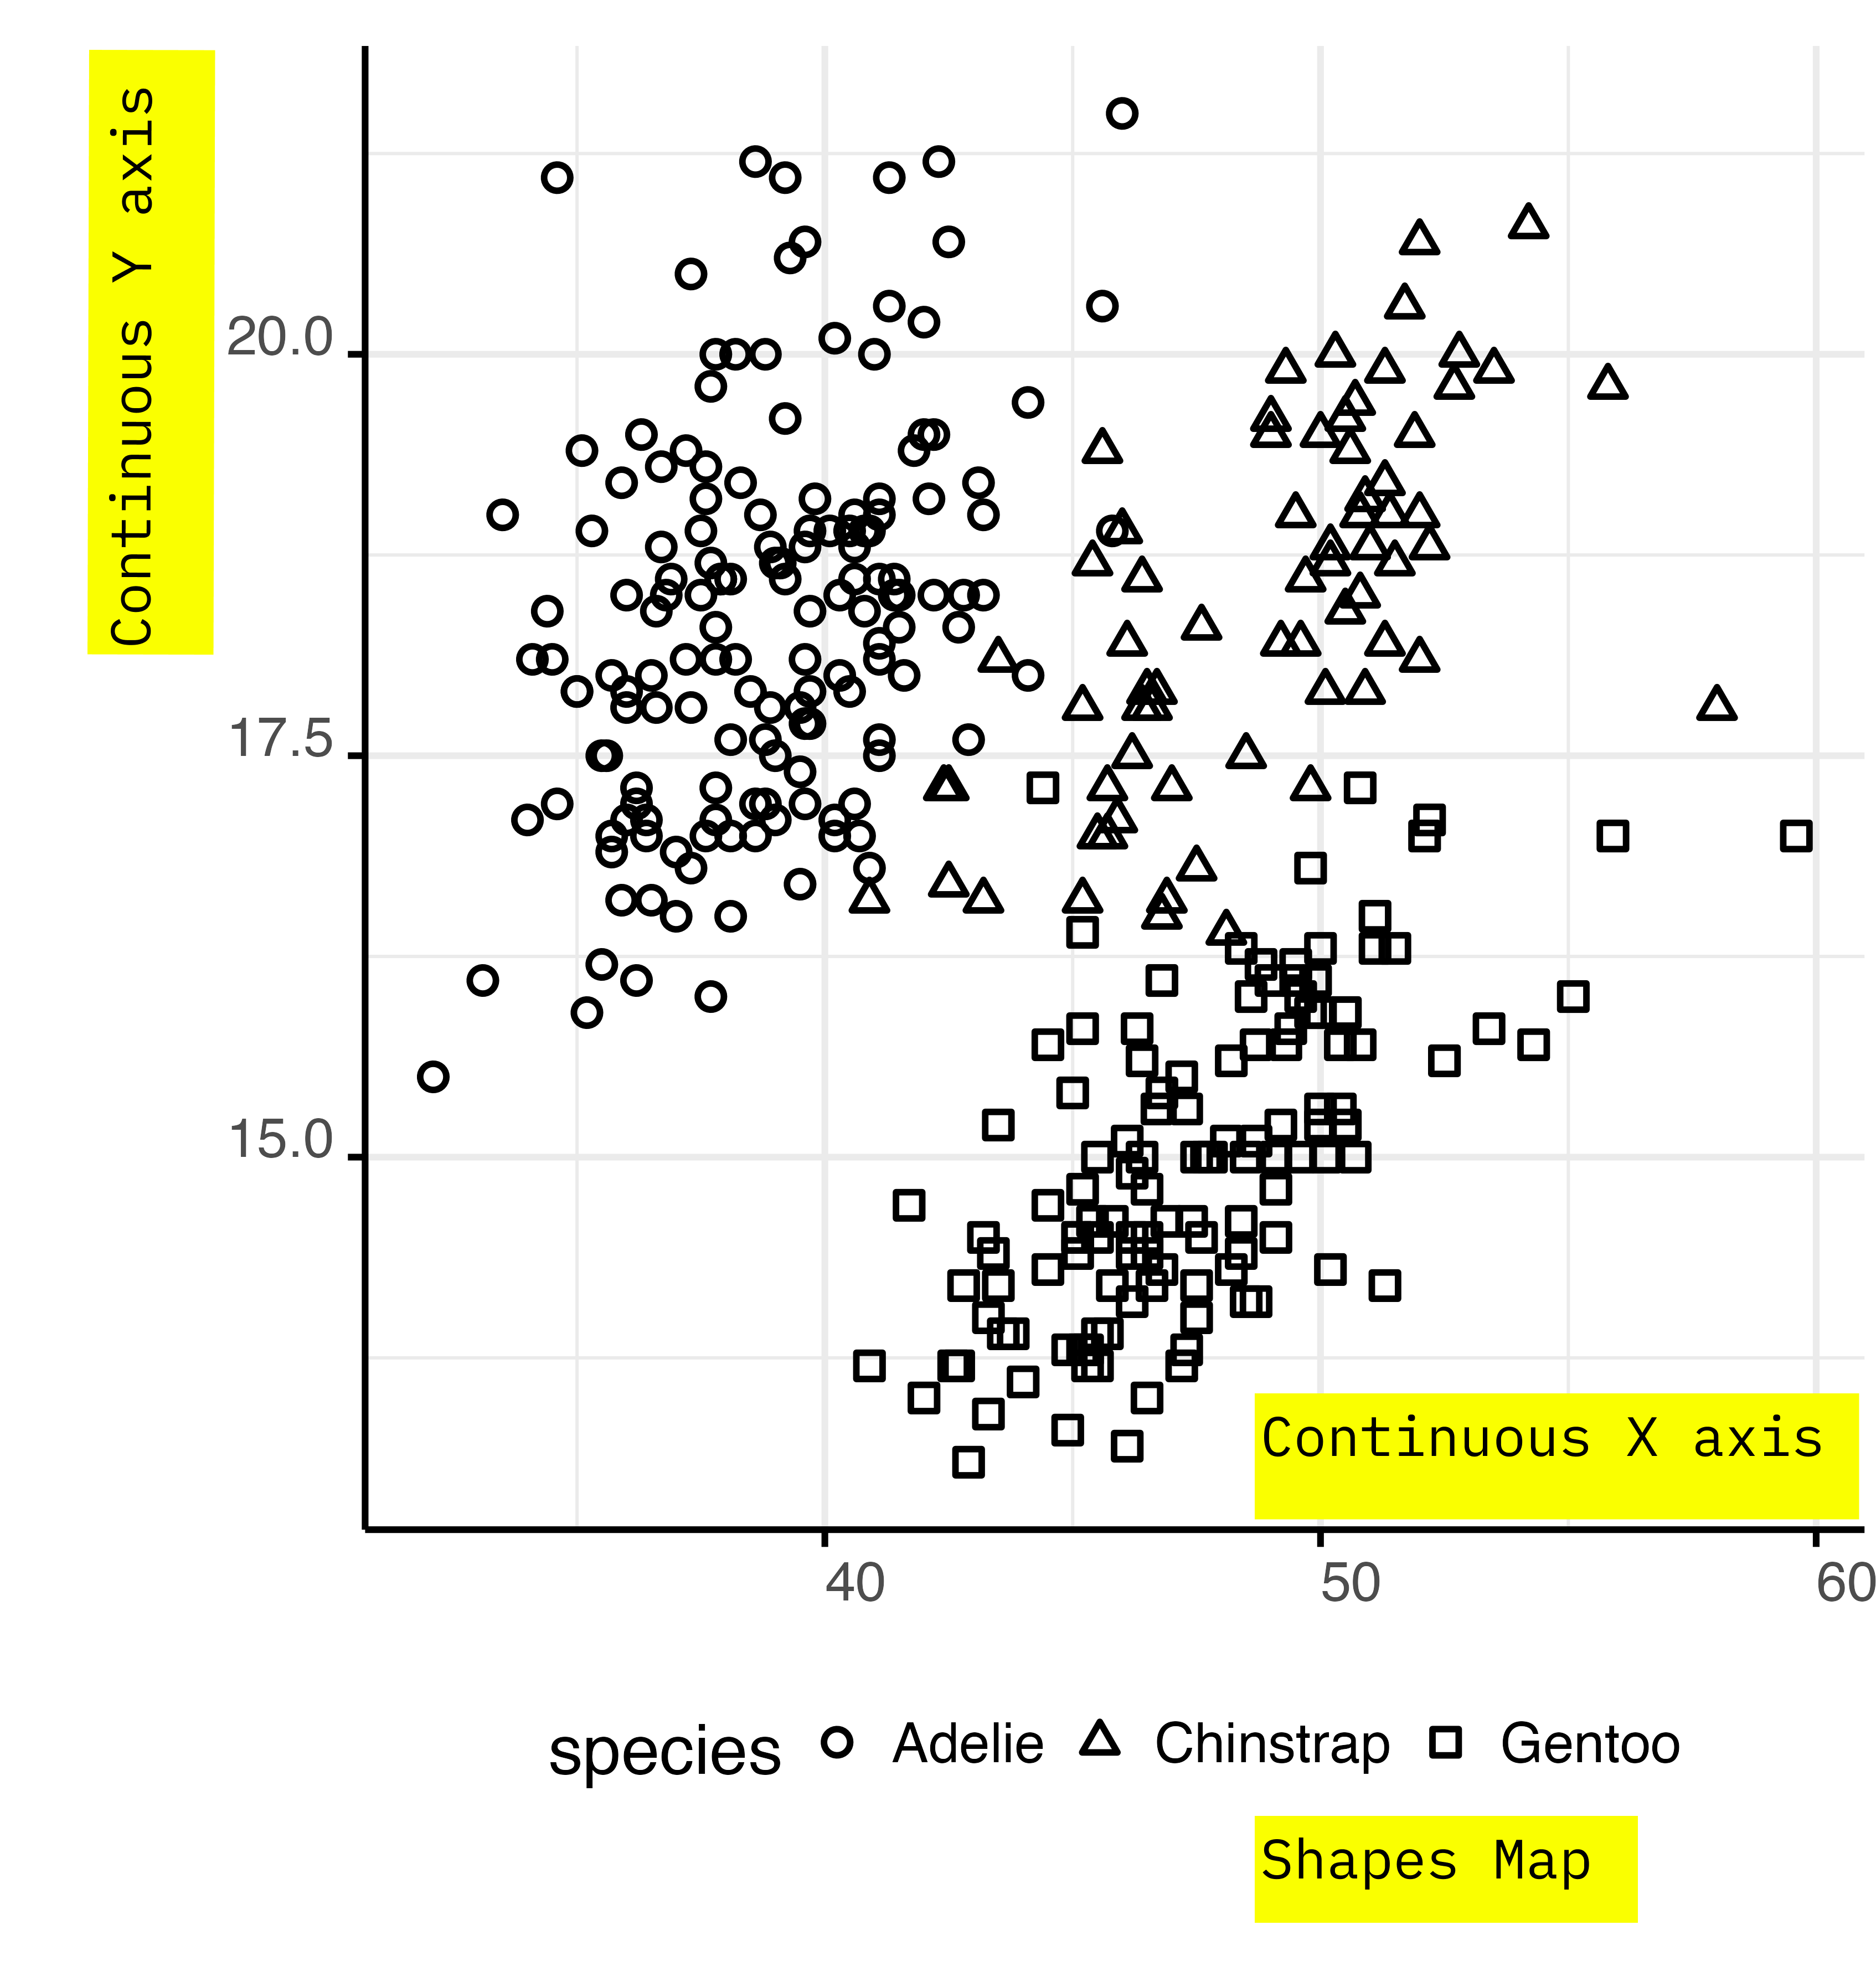
You can use point shapes to encode categorical information.
Shapes are simple and easy to understand.
They can’t be used to represent quantitative data. They could be used for ordered categorical data, but I’d advise against this practice.
Shape
Shape
Size and Area
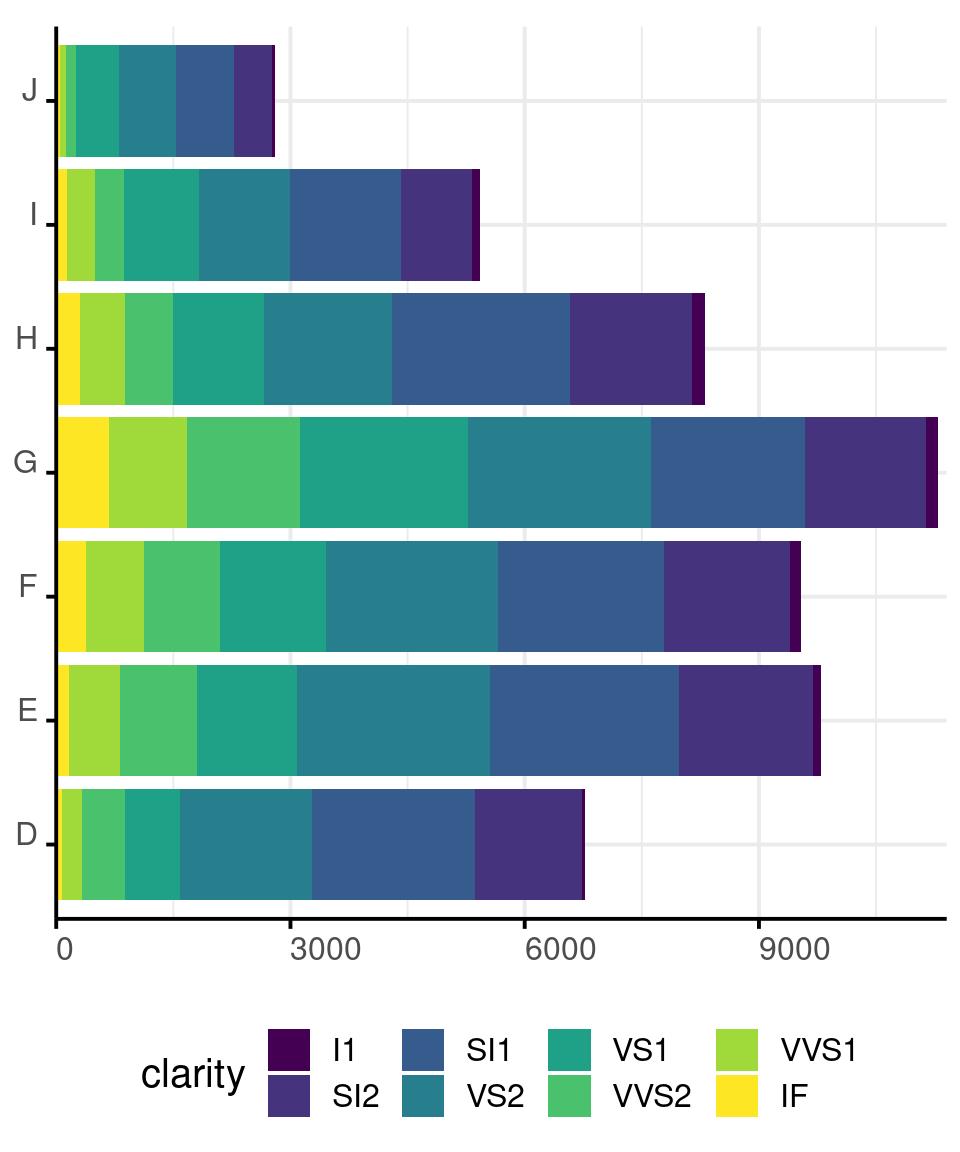
Linear size and area are often mapped to quantitative values, such as absolute measurements and percentages.
Size is often used together with colour to display a quantitative value stratified by a qualitative factor.
Size - Bar Chart
Size - Bar Chart
Size - Bar Chart
When we use a barolot, we map the data to the length of the bars, not to the area.
The area of the bars is directly proportional to the data values.
Though, conceptually, if we would be mapping the data to the bars’ area instead of their length, we could no represent negative values.
Area - Pie Chart
diamonds %>%
  filter(color == "J") %>%
  ggplot() +
  aes(x = color,
      fill = clarity) +
  geom_bar(position = 'fill') +
  coord_polar(theta = "y") +
  scale_y_reverse(
    expand = expansion(
      mult = c(0, 0)
    )
  ) +
  theme_void(
    base_size = base_size
  ) +
  theme(
    legend.position = "bottom",
    plot.margin = margin(10,5,5,5)
    )
Area - Pie Chart
Pie charts get a bad reputation for not being a nuanced analytical graphs.
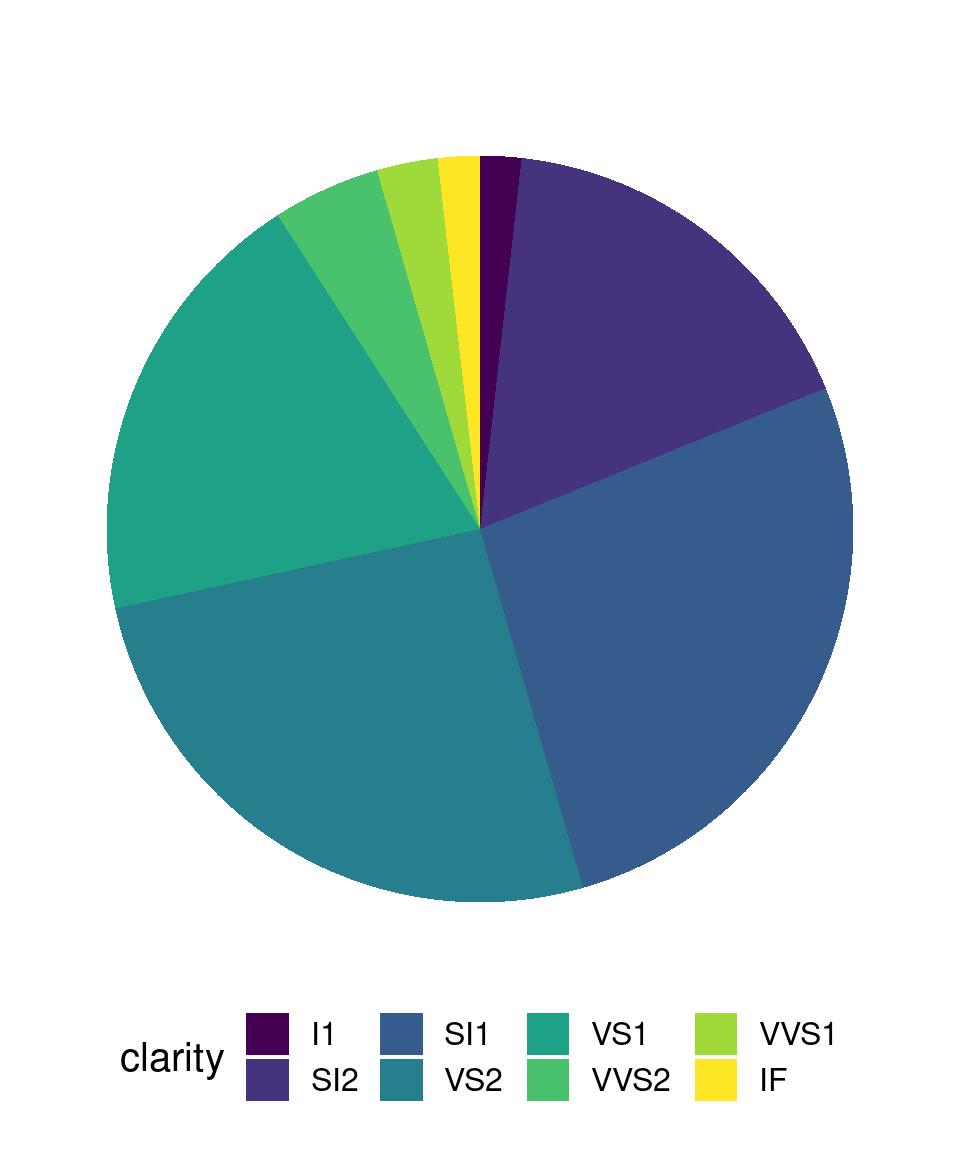
But pie charts are effective at representing percentages, and they outscore barcharts when the number of slices is high.
Can you describe the pie chart from the previous page in terms of the grammar of graphics?
Area of Circles and Shapes
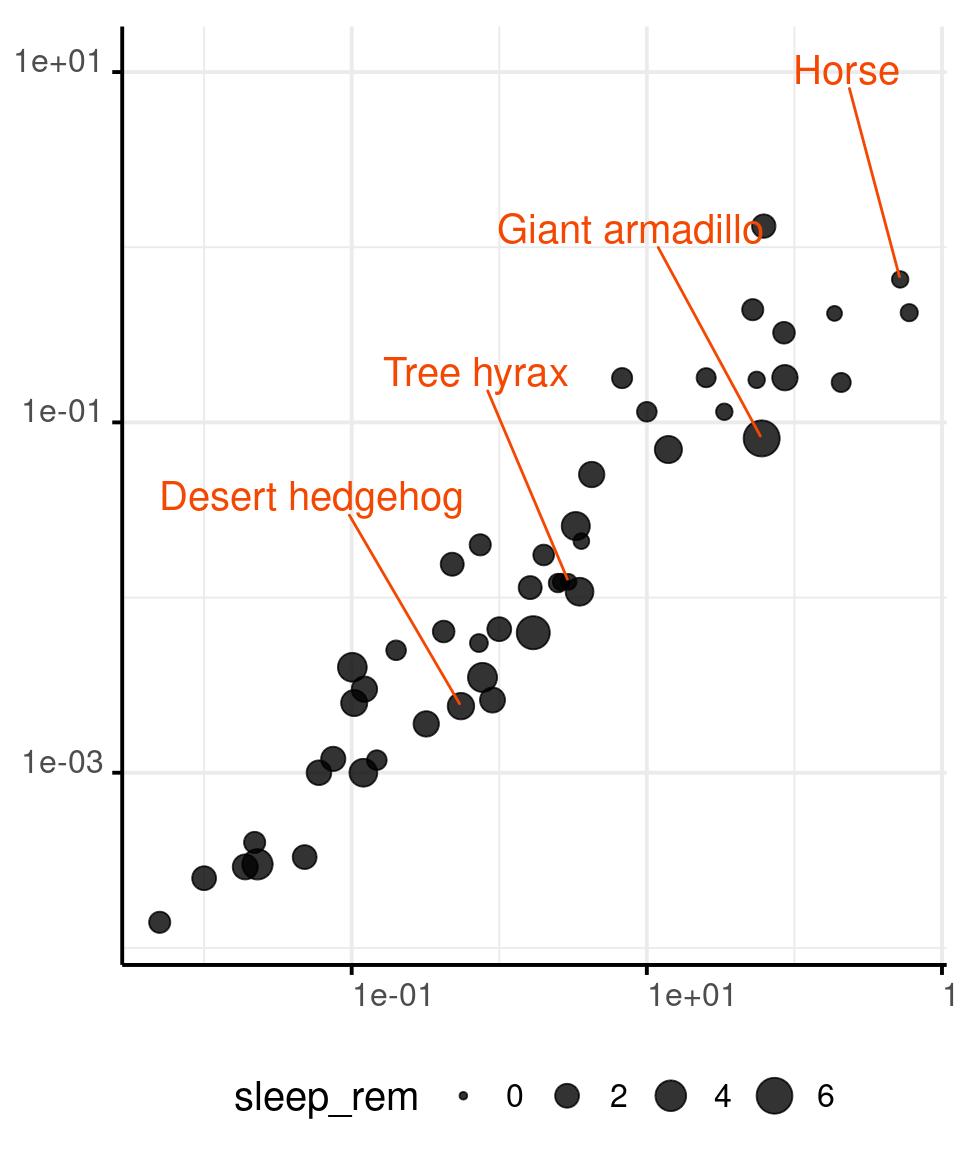
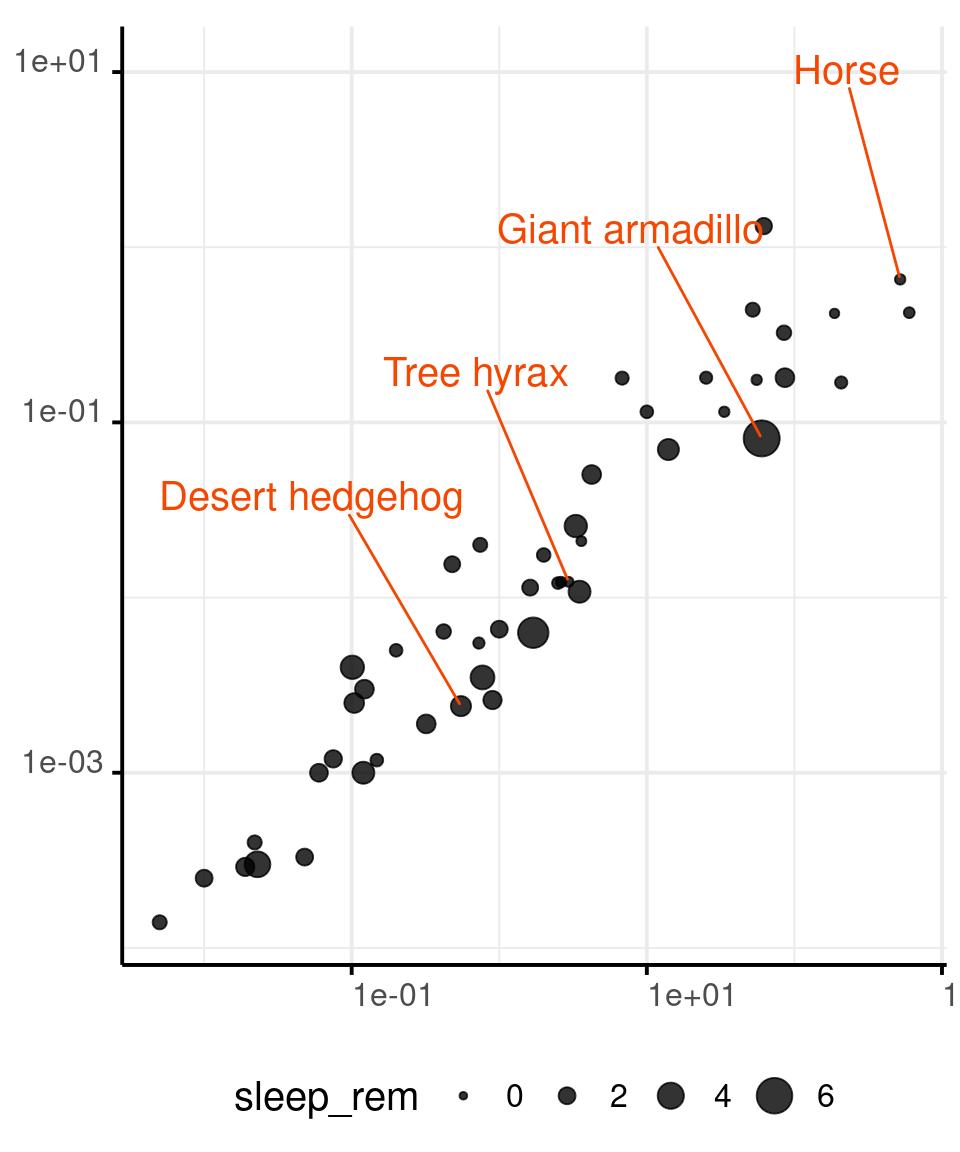
You can encode a continuous variable in the area of the circles in a scatterplot, or in the area the plotting character of your choice.
Our perception is not as good at comparing areas, so use this retinal variable with parsimony.
You can map data to the radius of circles or to the area directly. Mapping data to the radius might be perceptually better, although neither choice is optimal.
Area of Circles
msleep %>%
  drop_na(
    bodywt, brainwt,
    name, sleep_rem
  ) %>%
  ggplot() +
  aes(x = bodywt,
      y = brainwt,
      size = sleep_rem) +
  geom_point(
    alpha = .8
  ) +
  geom_text_repel(
    data = . %>%
      sample_frac(.08),
    aes(label = name),
    size = base_size/size_scale,
    min.segment.length = 0,
    direction = 'y',
    nudge_y = 1.2,
    hjust = 1,
    colour = '#f44702'
  ) +
  scale_x_log10() +
  scale_y_log10() +
  scale_size(
    limits = c(0, NA)
    )
Radius of Circles
msleep %>%
  drop_na(
    bodywt, brainwt,
    name, sleep_rem
  ) %>%
  ggplot() +
  aes(x = bodywt,
      y = brainwt,
      size = sleep_rem) +
  geom_point(
    alpha = .8
  ) +
  geom_text_repel(
    data = . %>%
      sample_frac(.08),
    aes(label = name),
    size = base_size/size_scale,
    min.segment.length = 0,
    direction = 'y',
    nudge_y = 1.2,
    hjust = 1,
    colour = '#f44702'
  ) +
  scale_x_log10() +
  scale_y_log10() +
  scale_radius(
    limits = c(0, NA)
    )
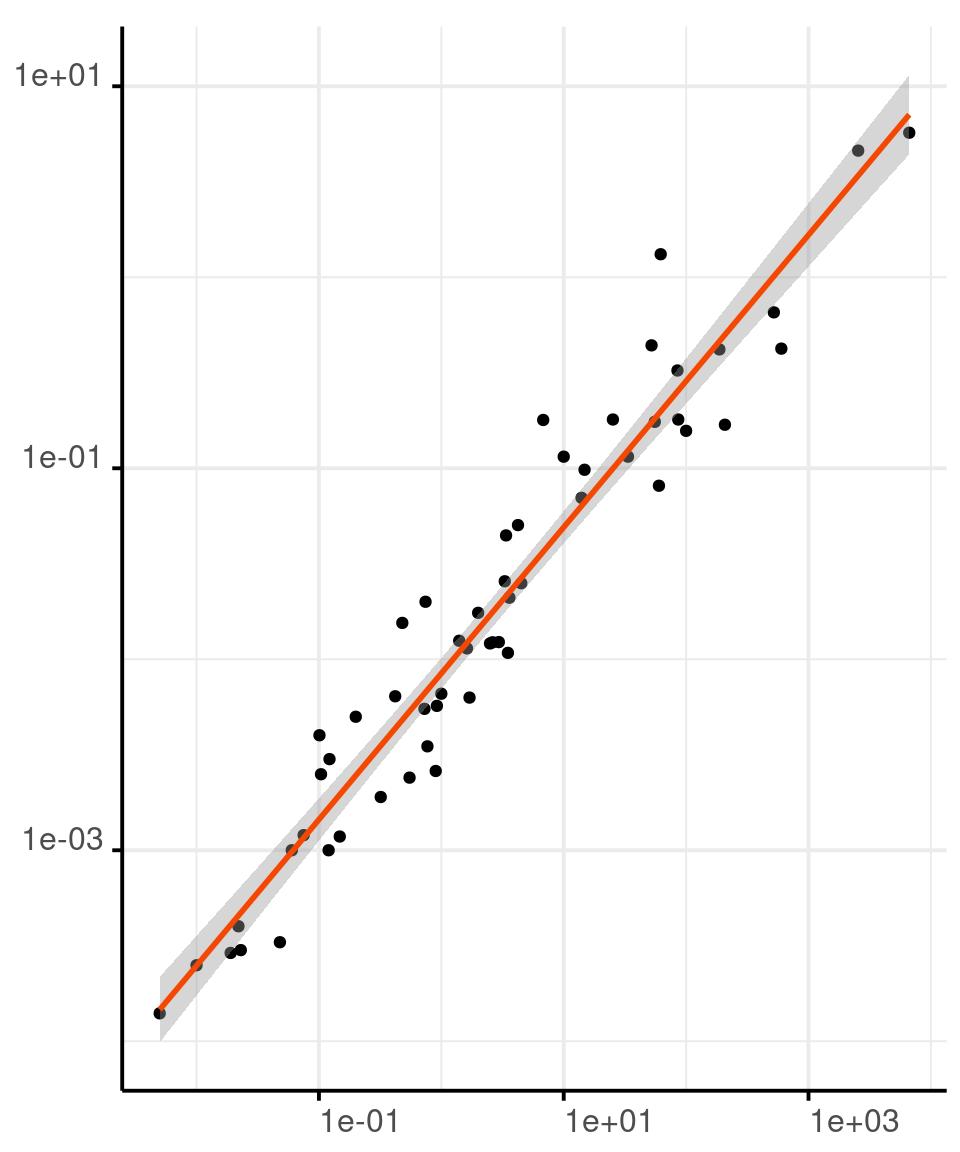
Area As Uncertainty
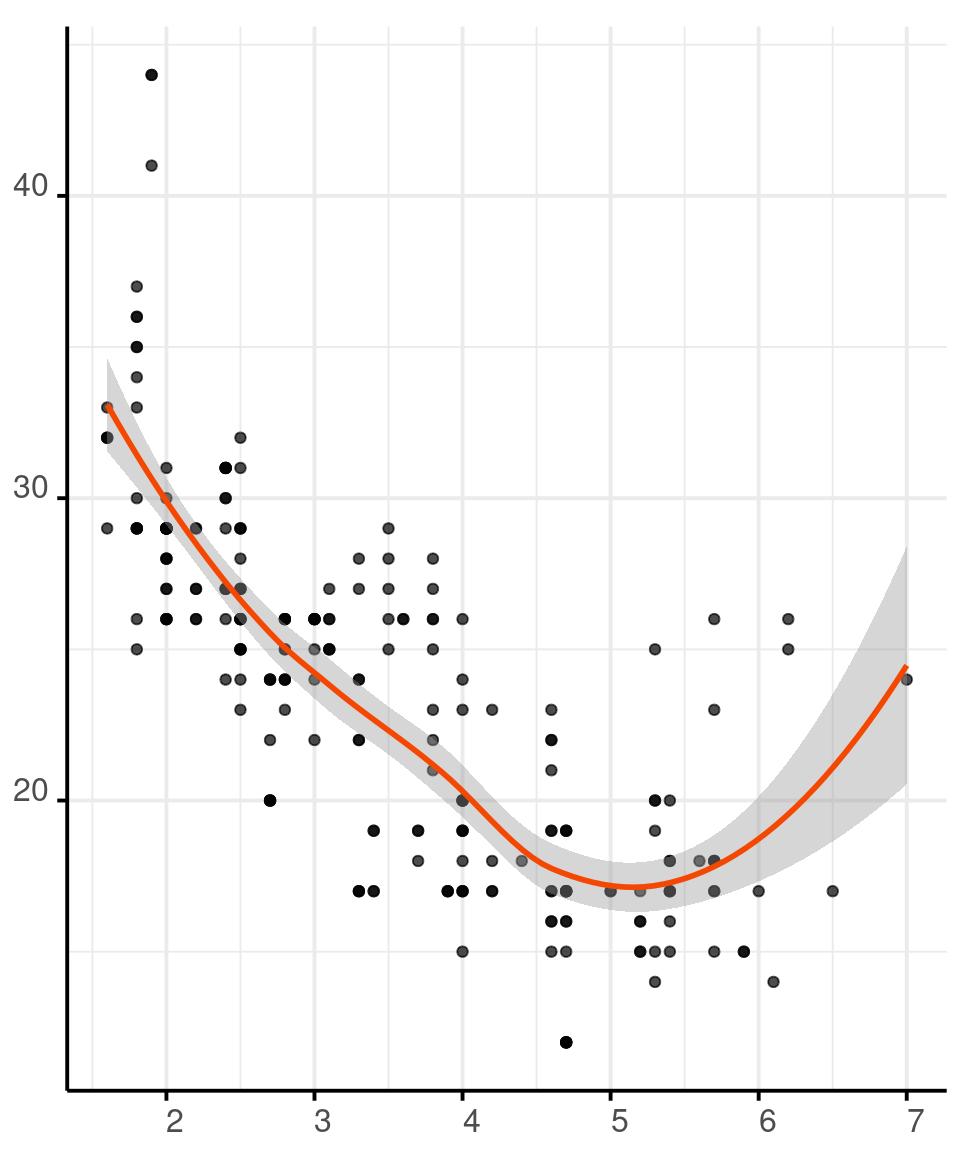
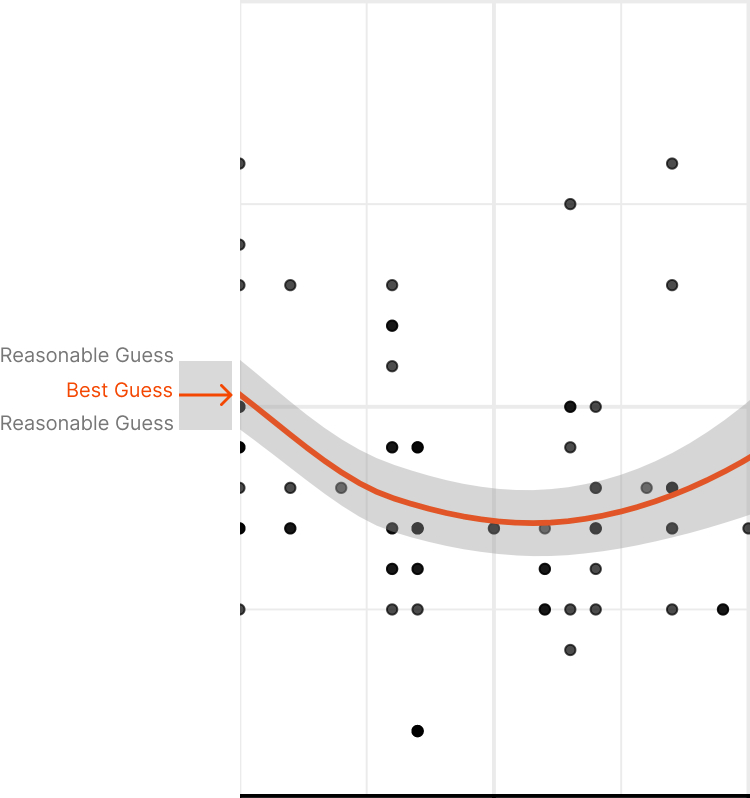
A light coloured area is often used to encode for a measurement of uncertainty or dispersion of the data.
For example, the confidence interval of a regression model, or the prediction of how a natural phenomena will evolve in space and time.
How to represent uncertainty intuitively, is an active field of research.
Area As Uncertainty
Area As Uncertainty
Area As Uncertainty
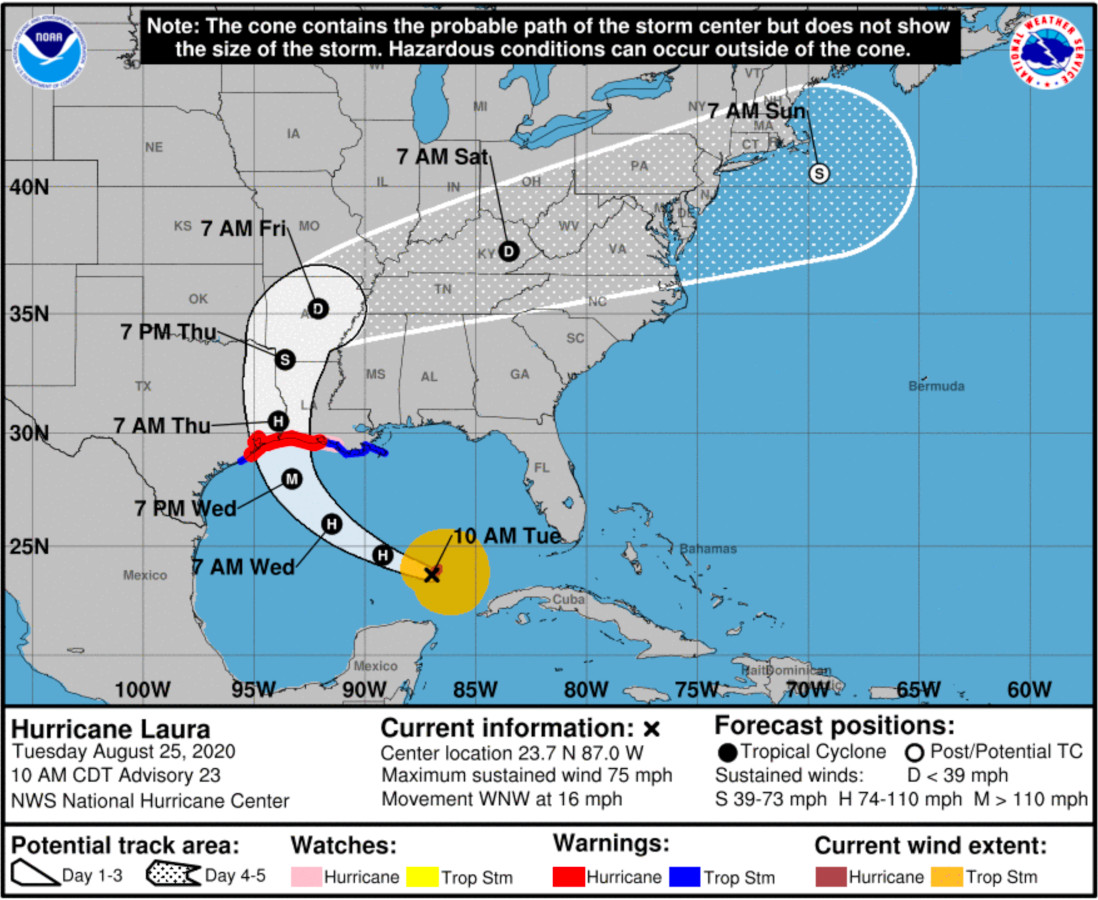
HURRICANE PROBABILITY CONE
Year: Current
Website: NOAA - Hurricane Center
The cone shows the forecasted path of the hurricane, from its current position. The size of the cone grows with the uncertainty in the path’s forecast
There’s evidence that we intuitively associate the size of the cone to the forecasted size of the hurricane, not to the uncertainty of its path.
Area As Uncertainty
How to represent uncertainty is an active area of research.
You can check Dr. Lace Padilla’s Work, for an overview of the best practices and the latest findings.
Orientation

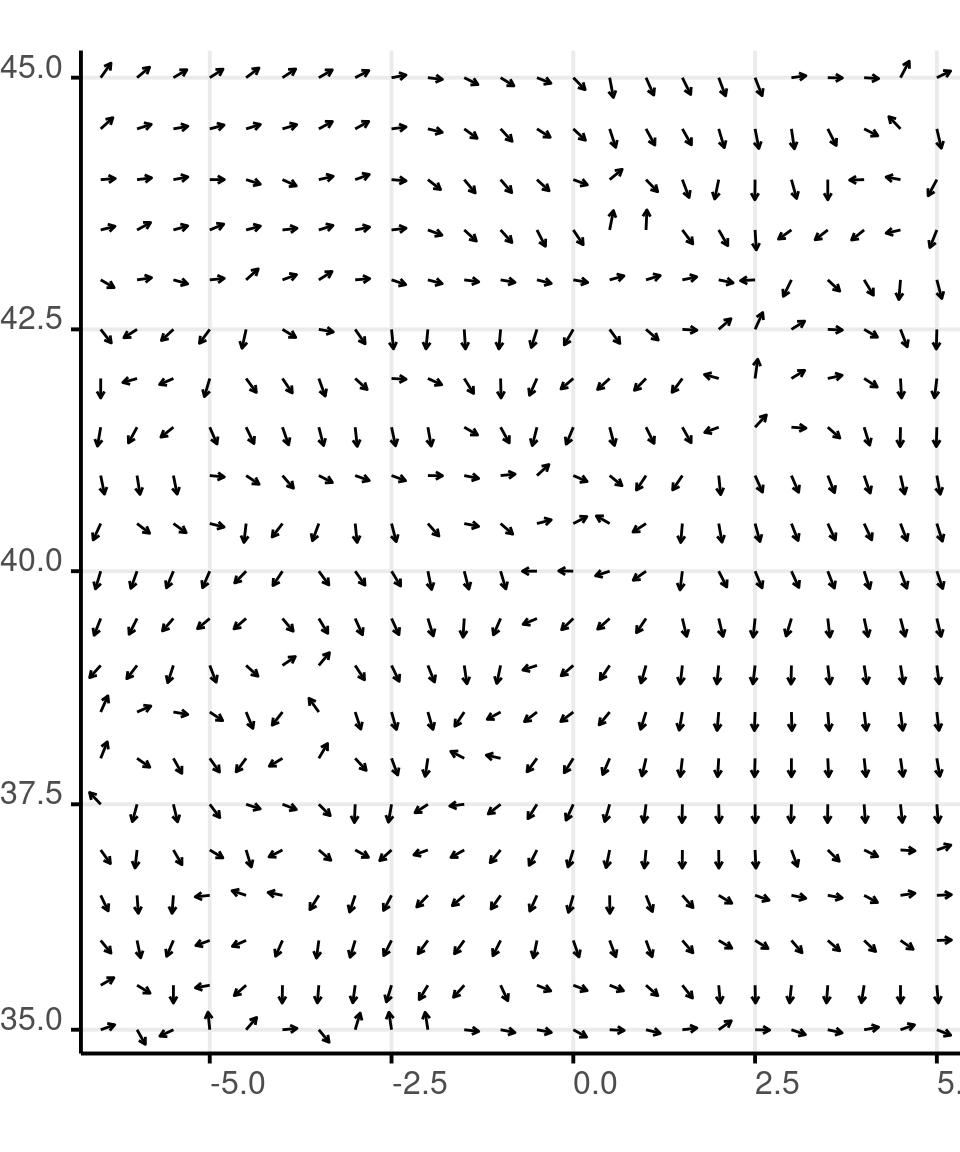
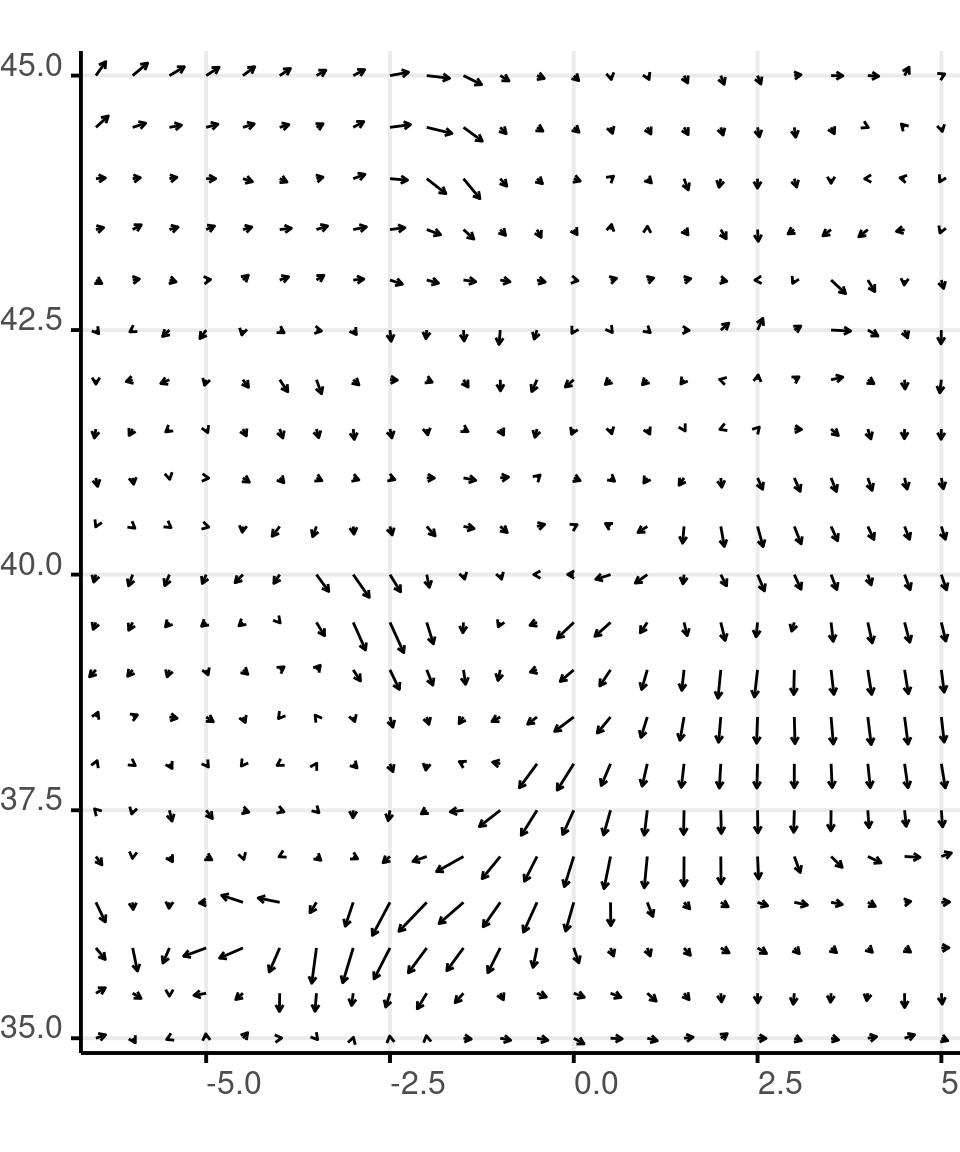
The orientation of plotting characters is used to show the vectorial orientation of dimensions such as wind or other types of movements on a map.
The orientation of plotting characters is often used combined with their length, to show intensity and direction.
Orientation

In ggplot there is no way to control the orientation of a plotting character directly. So you’ll have to use a segments, calculating their start and end points from data.
Orientation
load('data/wind.data.RData')
wind <- wind.data
rm(wind.data)
wind %>%
  filter(lon > -7) %>%
  ggplot() +
  aes(
    x = lon,
    y = lat,
    xend = (
      lon + cos(
        dir*pi/180
      )/5
    ),
    yend = (
      lat + sin(
        dir*pi/180
      )/5
    )
  ) +
  geom_segment(
    arrow = arrow(
      length = unit(1, 'mm')
    )
  ) +
  scale_x_continuous(
    expand = expansion(
      mult = c(.01, .01))
  ) +
  scale_y_continuous(
    expand = expansion(
      mult = c(.01, .01))
  ) +
  coord_map() +
  theme(
    plot.margin = margin(
      0, 0, 0, 0
    )
    )
Orientation and Size
wind %>%
  filter(lon > -7) %>%
  ggplot() +
  aes(
    x = lon,
    y = lat,
    xend = (
      lon + speed*cos(
        dir*pi/180
      )/20
    ),
    yend = (
      lat + speed*sin(
        dir*pi/180
      )/20
    )
  ) +
  geom_segment(
    arrow = arrow(
      length = unit(1, 'mm')
    )
  ) +
  scale_x_continuous(
    expand = expansion(
      mult = c(.01, .01))
  ) +
  scale_y_continuous(
    expand = expansion(
      mult = c(.01, .01))
  ) +
  coord_map() +
  theme(
    plot.margin = margin(
      0 ,0 ,0, 0
    )
  )
Orientation and Size

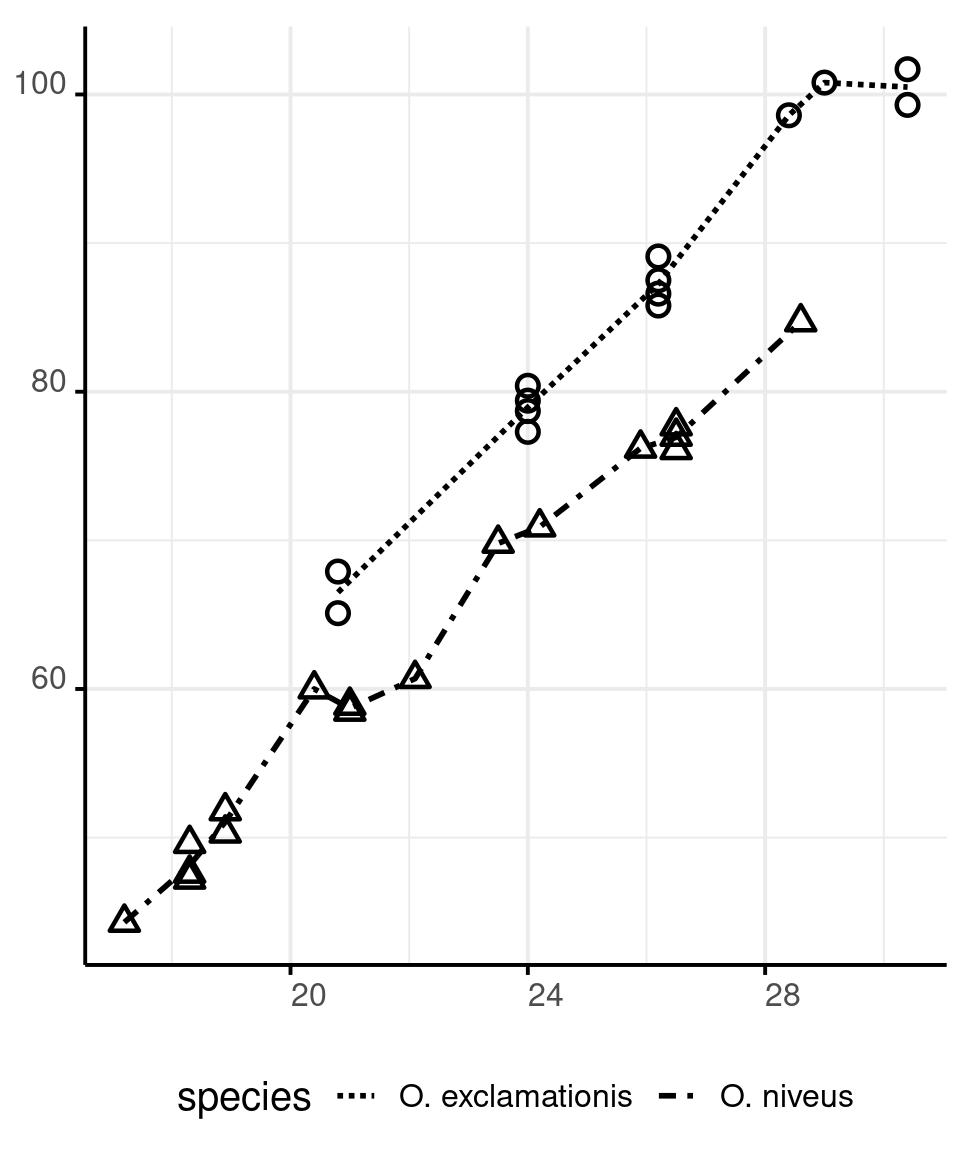
Texture
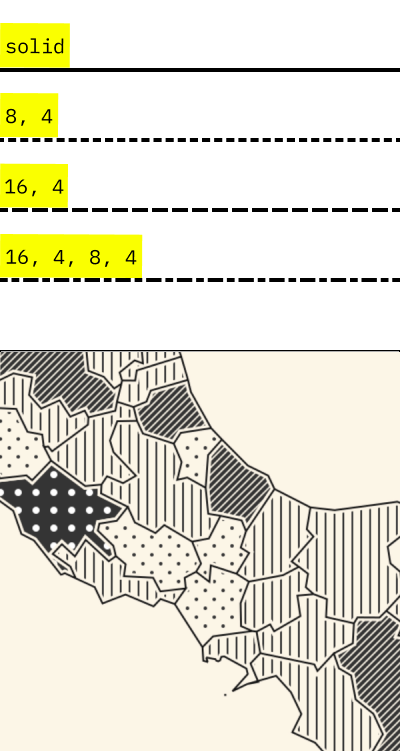
The texture is often used to encode categorical data in various types of lines.
It can also be used to fill shapes in a semi-quantitative way. This aspect fell in disuse, but it can be a good choice for printer-friendly visualization.
GGplot does not support filling shapes with patterns natively. But you can do it with the package ggpattern.
The example on the side is from texture.js instead, a js library for textured web graphics.
Line Type
Exercise #1
On 2021-02-16, TidyTuesday published a challenge to remember the work of W.E.B Du Bois.
On this Github Page you can find the data for 10 of the renown Du Bois’ charts
Redesign or just redraw one or more of Du Bois’ graphs. Feel free to modify them as much as you want, but explain your design choices and how they improve the original graph.
Exercise #2
On 2023-08-22, TidyTuesday published a challenge on UNHCR’s migration data.
You can find data and further information in this github repository.
Explore those data, find a message that you would like to communicate, design a graph to convey that message. Explain your stylistical choices, how do they help you convey your message.
