---
title: "My Quarto Project"
author: "Otho Mantegazza"
date: today
editor_options:
  chunk_output_type: console
---

# My Analysis

A very unexpected data analysis.

```{r}
iris
```

# Results

Iris have petals and sepals.

```{r}
plot(iris$Petal.Length,
     iris$Sepal.Length)
```

# Conclusions

Iris are flowers.>Open Tools for Scientific Publishing
> Present your research in an elegant and reproducible way.
\ Otho Mantegazza _ Dataviz for Scientists _ Part 4.1
Let’s Try it
This is one of the most hands on section of the workshop. The best way to learn how to use this publishing tool, is to use it.
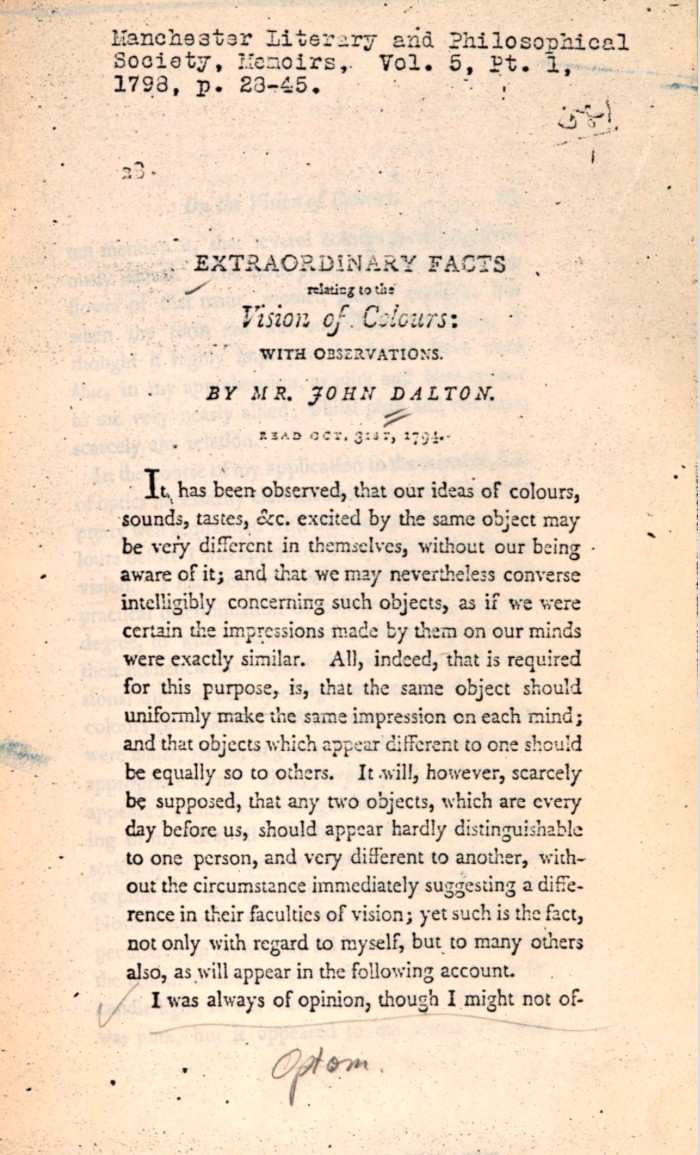
SCIENTIFIC PUBLICATION ON THE DISCOVERY OF COLOUR BLINDNESS
Author: John Dalton
Year: 1794
Source: Hathi Trust
The father of the atomic theory John Dalton, realized that people might perceive colour differently and devised an experiment to test it. Discovering colour blindness, and that he was colour blind himself,
Early scientific publications where in the shape of carefully crafted, extensively discursive booklets. Obviously, printed on paper.
Scientific Publishing
The main form of publication for a scientist still is the article on peer reviewed journals.
Although, as a scientist, you will find yourself communicating your work in many channels, such as reports, blog posts, presentations, books.
Or videos, posts on social media that unfortunately we will not cover here.
None of them less important than the peer reviewed article for making sure that your work reaches the people that need it and have an impact.
Literate Programming
Data Driven Documents
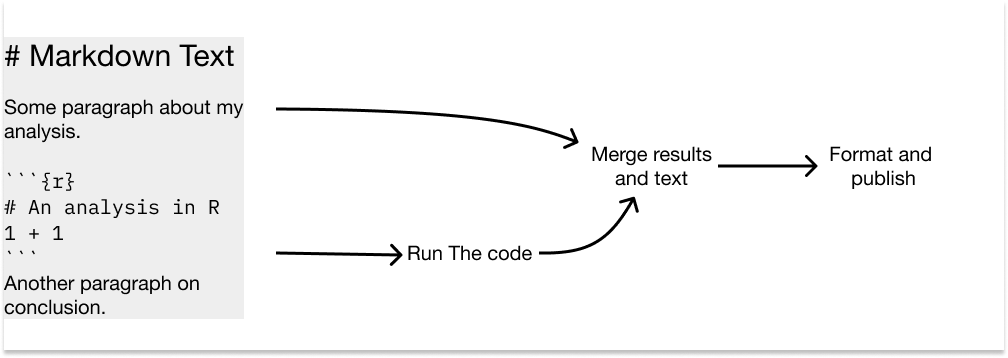
As a quantitative scientist, your publications will often be data driven.
To make a data driven report, your best choice is to prepare documents with in which text and analytic code are tightly knit together, in this way you don’t have to update the results manually if the starting data or the analytic code change on the way.
This will make your analyses more reproducible.
Markdown
Markdown is an extremely simplified markup language. Also known is WYSIWYM: what you see is what you mean. When you write in Quarto you use markdown.
Two Editor Paradigms
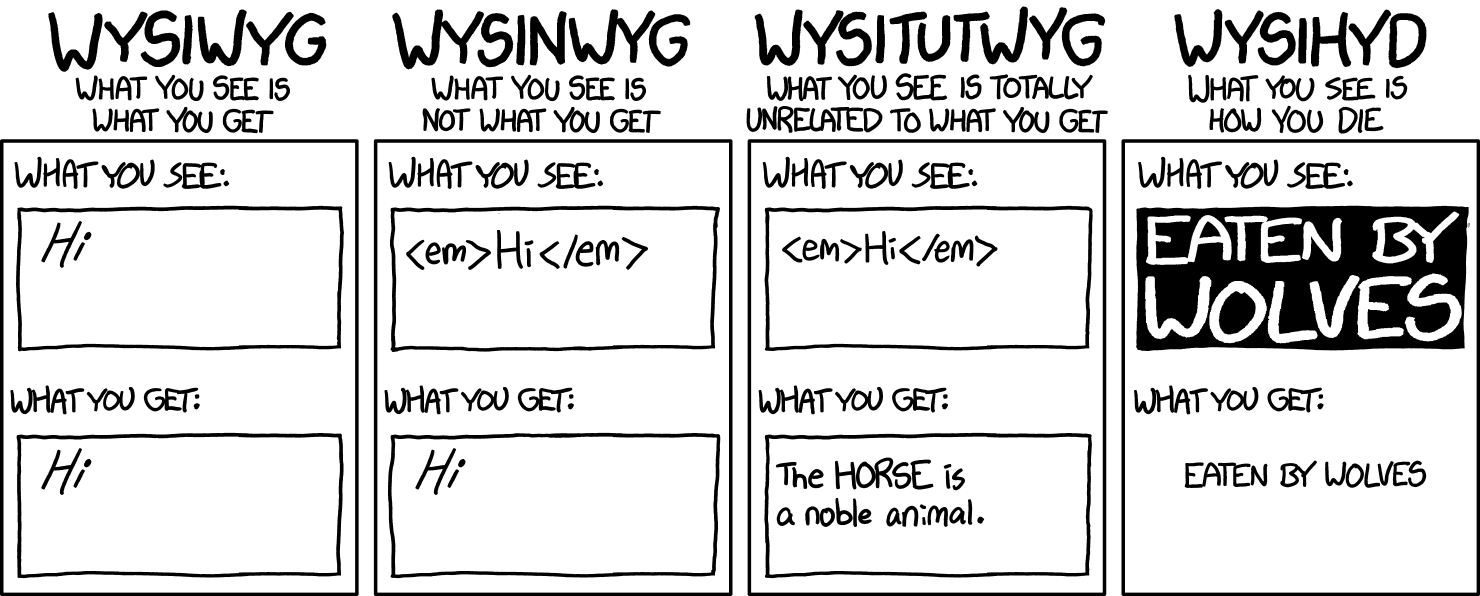
WYSIWYG
What you see is what you get: while your write, on your screen, you see formatted text. If you want to break a paragraph you see a paragraph break, if you want italic text you see italic text and so on.
For sure you have used WYSIWYG editors, such as Microsoft Words, or Google Docs.
Markdown
Markdown is a markup language that’s simple and easy to read.
More Markdown
More Markdown
Exercise
Use this online markdown editor to reproduce (by copying and pasting) the main content of R for Data Science’s Chapter on Quarto.
Try to reproduce all formatting, such a bold text, lists, code blocks. Add the functional links.
If needed, get help this markdown guide or any manual and forum that you find and like.
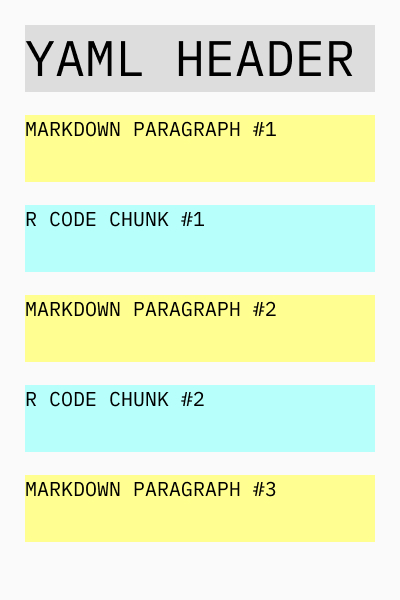
Quarto
With Quarto you can combine markdown text with code in many programming languages and produce many types of output.
Quarto Languages
Programming Languages:
- R
- Python
- Julia
- Javascript
Quarto Output
Websites:
- Reports
- Blogs
- Slides
PDF / EPUB
- PDF:
- Journal Articles
- Reports
- Epub
Others
- MS Words
- MS Power Point
- Open Office
Quarto File
x
My Quarto Project Structure
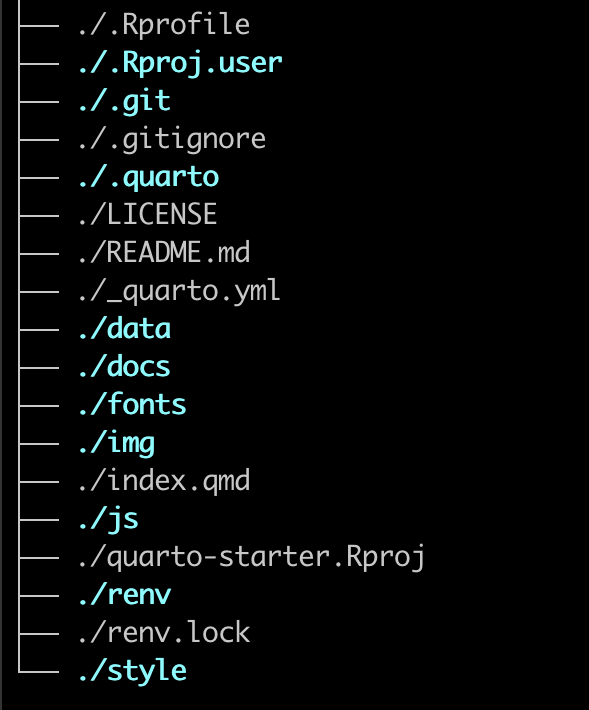
This is the project structure that I use for Quarto, when I work on web based project (such as these slides).
You can download a starter folder with this structure from this Github repo.
More Info
For more information on Quarto, please follow the tutorial on Quarto’s website, they are very clear and well done.
Exercise
Try Quarto:
- Install Quarto CLI on your computer.
- Download and unzip the quarto-starter folder from this Github repo.
- On your computer, open the file quarto-starter.Rproj in Rstudio.
- Run this line of code at the R console to install all the packages used in this project through renv
Continue the on next page →
Exercise
→ from the previous page.
- Serve the Quarto project locally, by typing at the terminal console:
- On your browser open the local host http://localhost:4200 to preview your quarto project.
- Open the file index.qmd in rstudio, edit it, save your results. See how the preview in the browser changes accordingly.
Files in Quarto Projects
The main files in a web based Quarto projects are:
- _quarto.yaml
- index.qmd
- Any other .qmd files
_quarto.yml
_quarto.yml is a configuration file in YAML format:
project:
  title: "My Quarto Starter Pack"
  preview:
    port: 4200
  output-dir: docs
  render:
    - "*.qmd"
  resources:
    - img/
    - fonts/
    - js/
    - style/

format:
  html:
    theme: style/custom.scss
    toc: true

knitr:
  opts_chunk:
    dev: jpeg
index.qmd
index.qmd is the quarto file that produce the page that stands at the root (home page) of your website.
---
title: "Dataviz for Scientists"
author: "[Otho Mantegazza](https://othomantegazza.com/)"
format:
  html:
    toc: true
    theme:
        - style/fonts-landing.scss
        - style/custom-landing.scss
    include-in-header:
      text: >
        <meta property="og:title" content="Dataviz for Scientists">
        <meta property="og:description" content=" Material and exercises for a three days workshop on data visualization for scientists in R and a bit of Javascript. By Otho Mantegazza.">
        <meta property="og:image" content="img/front.jpg">
        <meta property="og:site-name" content="Data Visualization for Scientists">
        <meta property="og:locale" content="en_EU">
---

# Introduction

Communication is essential for any kind of scientist. Your research findings might contain the most important results, but if you don’t manage to communicate them to others, they might be like a tree falling in a forest with no one around. Do they make a sound?

A huge part of results today depends on data, and communicating data effectively is a skill made of many components. Representing data graphically is a big part of it.

In this workshop you will learn how to communicate data graphically, and how to use literate programming to make your graphics available to others, together with text and analytical code.

For this three days workshop, we will use R and Javascript to analyze and visualize the data.

With [Quarto](https://quarto.org/), a modern literate programming tool dedicated to scientific communication, we will put it all together, to let you communicate your data in beautifully formatted outputs, which are easy to read, but also reproducible and transparent for the analytical mind.

In the extensively hands-on sessions we will focus on real-world data, and if you would like to, you are welcomed to bring your own data to the workshop.

All the software, programming language, and resources used in this workshop are open source and open access. In this way the participants will have full control on the tools that they use and will be able to access them after the class is over, free from unfavorable commercial licenses. All the tools are cutting edge in both industry and academic fields.

# Slides

Below you can find the link to the slides.

## Part 1: Welcome to R

Day 1.

1. [Introduction](100-intro.html)
2. [Meet R](110-meet-r.html)
3. [Use Data in R](120-manipulate.html)
4. [Missing Values](130-missing-values.html)
5. [Load New Data Into R](140-load-data.html)
6. [Clean and Tidy Data](150-clean.html)

## Part 2: Intro to Data Visualization

Day 2, morning.

1. [Instant Knowledge](200-instant-data.html)
2. [Quick History of Dataviz](210-history.html)
3. [The Grammar of Graphics](220-gg.html)
4. [Exploratory Data Analysis](230-eda.html)

## Part 3: Better Graphs

Day 2, afternoon.

1. [Better Graphs - Part I](310-better-graphs.html)
2. [Better Graphs - Part II](320-better-graphs-2.html)

## Part 4: Scientific Publishing

Day 3, morning.

1. [Quarto: Open Tools for Scientific Publishing](410-sci-pub-tool.html)

## Part 5: Web Development

Day 3, afternoon.

1. [Why Learn Web Development?](500-web-dev.html)
2. [Data Visualization in Javascript](510-dv-js.html)

# Resources

Besides the slides, you can consult any of these [open access books](https://othomantegazza.com/textbook-library) on the topics of data analysis, statistics, programming and data visualization. The authors of those books made them open access, so they can be consulted online anytime.

# Packages

There's some package that we are going to use in most exercise. To be sure that you have them ready, install them by running at the R console:

```r
install.packages(
  c('tidyverse',
    'palmerpenguins',
    'here',
    'janitor',
    'paletteer')
)
```
At the beginning of each one of your script, you can load them by writing:

```r
library(tidyverse)
library(palmerpenguins)
library(here)
library(janitor)
library(paletteer)
```

# Source Code

The source code for these slides is on Github at [https://github.com/othomantegazza/dataviz-for-scientists-slides](https://github.com/othomantegazza/dataviz-for-scientists-slides)

# License

This work is licensed by Otho Mantegazza under the [CC BY-NC-SA 4.0 license](https://creativecommons.org/licenses/by-nc-sa/4.0/legalcode). For more information about the non-original bits and pieces, please check the file [LICENSE](https://github.com/othomantegazza/dataviz-for-scientists-slides/blob/main/LICENSE) on this course's [Github repo](https://github.com/othomantegazza/dataviz-for-scientists-slides).

# Acknowledgements

Big thanks to [Giorgia Ditano](https://giorgia-dit.github.io/about/) for the help and support in reviewing the course material.
Style
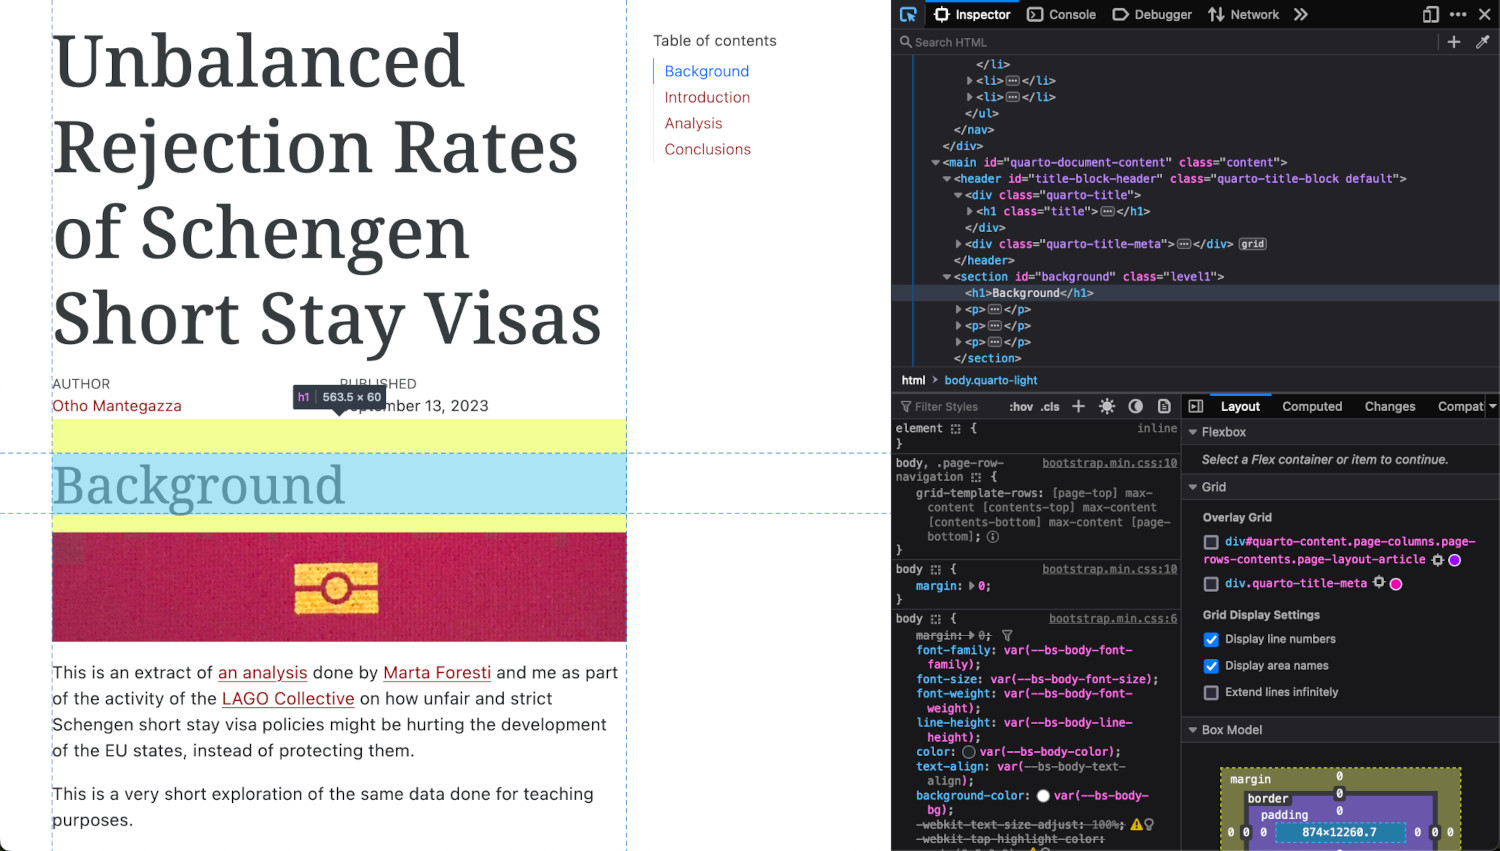
Inspect HTML elements
In Firefox, you can open the page inspector with
- Ctrl + Shift + C on Windows or Linux.
- Cmd + Shift + C on Mac OS.
You can use it to identify the name of the page elements that you want to style.
Exercise
Explore data in your own web based Quarto project.
You can choose to start from:
- Downloading this example Quarto project, which you can find deployed here. Give a look at this option also as an example of what you can do.
- From the empty Quarto Starter, which we used in the previous exercise.
- By starting your own Quarto project, in Rstudio, from scratch.
More info on next page…
Exercise
…chose some data that you would like to analyze and report on them, combining data visualization, and text.
On data, you have many options:
Schengen statistics on short stay visa, which are already included in the example Quarto project.
This dataset on microchip development.
Any dataset from previous exercises, that you liked and that you would like to keep working on.
Feel free to experiment with Quarto, to modify styles, headers and settings, don’t be afraid to break things.
Exercise
(EXTRA)
Publish your results online in a website.
- Make a free Netlify account.
- Start a new website from manual deploy.
- Drag and drop the docs/ folder of your quarto project into Netlify and see it go live online.
Watch out! everything that’s in the docs/ folder will become public, check that you did not include any sensitive personal information in your analysis.